

Troubleshooting Bottlenecks : Using SQL Server Profiler & Windows System Monitor Together
Here is a situation – users are complaining about a slow SQL server response.
We want to quantify if that is result of a hard hitting SQL query or this is to do with some application/background jobs running on the server.
Let’s put to practise our skills from http://www.oracledbasupport.co.uk/troubleshooting-bottlenecks-using-sql-server-profiler-part-iv/ & http://www.oracledbasupport.co.uk/troubleshooting-bottlenecks-using-windows-system-monitor-part-i/
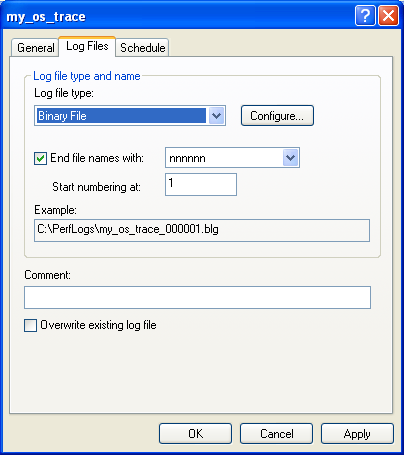
Please initiate a Trace on SQL server before going ahead. Within a SQL server Profiler window click on the top button for “Performancve Monitor” to enable logging.
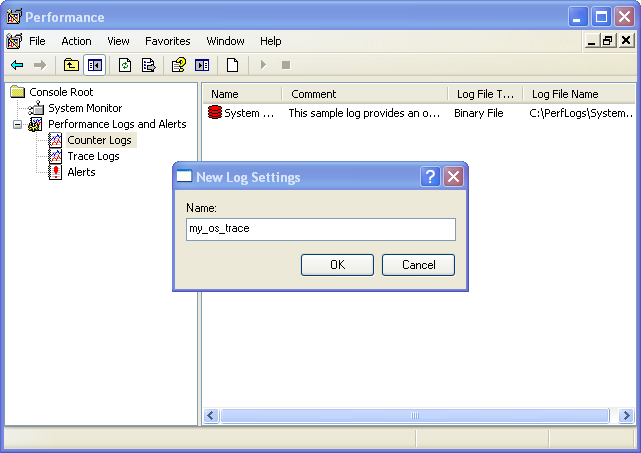
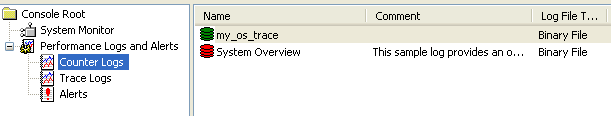
Click on my my_os_trace counter highlighted i RED and hit START , the icon Will go Green now.
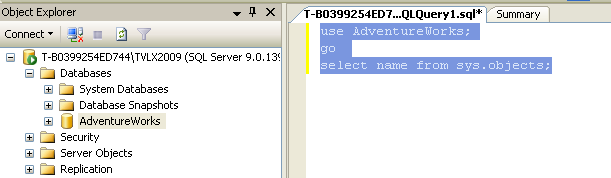
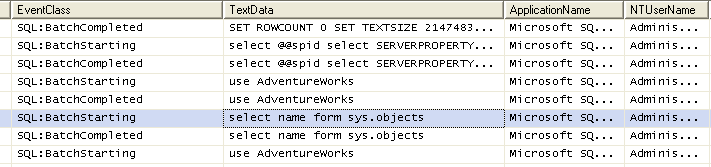
Let’s go to management Studio and run some SQL stmts as below to create an activity.
I will now go and stop the trace as well as OS stats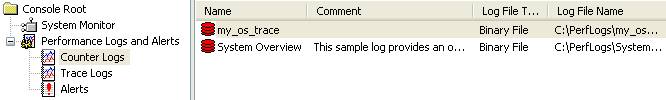
I am going to make sure trace files are available at directory C:\perfLogs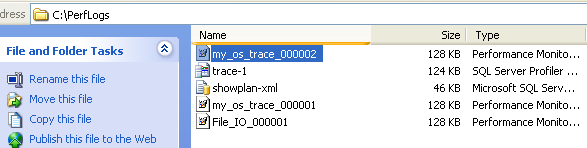
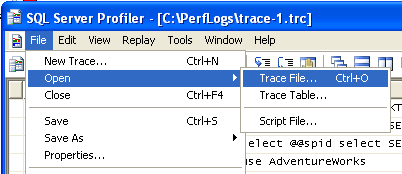
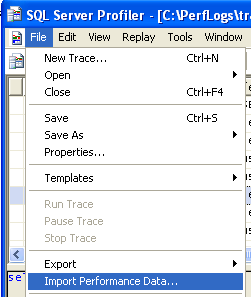
Let’s go back to Profiler and import trace files to map SQL execution with OS stats captured from performance Monitor
I am going to select file “my_os_trace_000002”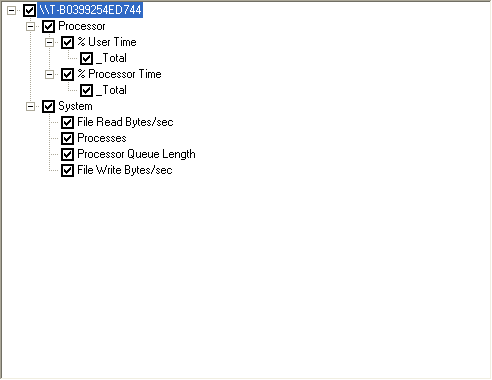
Finally you will see a screen like one below. Highlight the SQL statement to see the server load at that moment of time. The time is displayed in solid RED BAR. 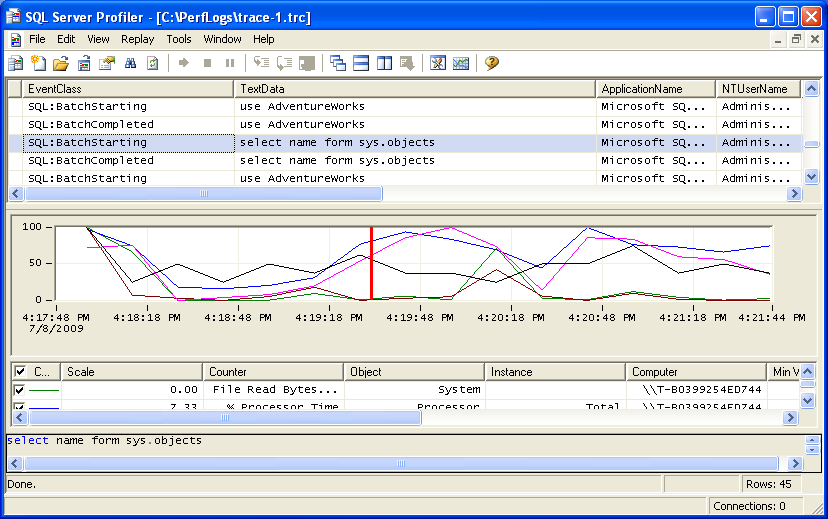
Leave a Reply
You must be logged in to post a comment.