

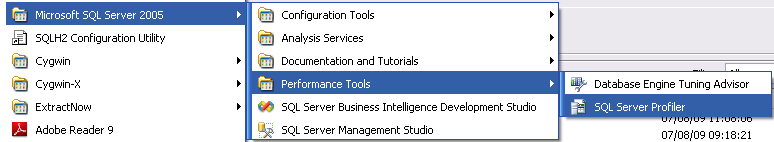
Troubleshooting Bottlenecks Using SQL Server Profiler : PART IV
- Windows System Monitor – PART I
- DBCC commands – PART II
- Dynamic Memory Views – PART III
- SQL Server Profiler – – PART IV
SQL Server Profiler – – PART IV
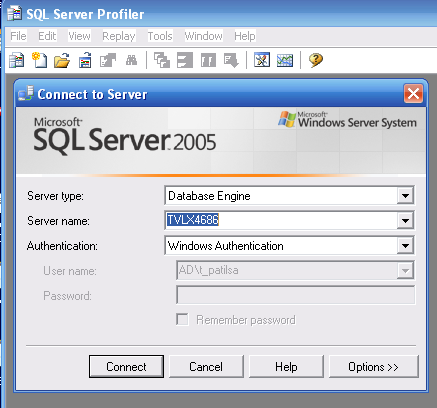
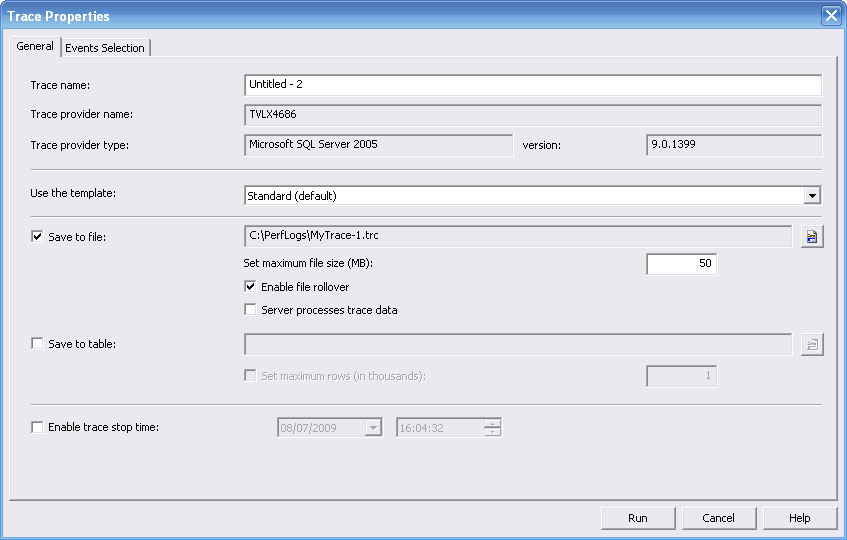
Once connected select location for TRACE file and name your trace.
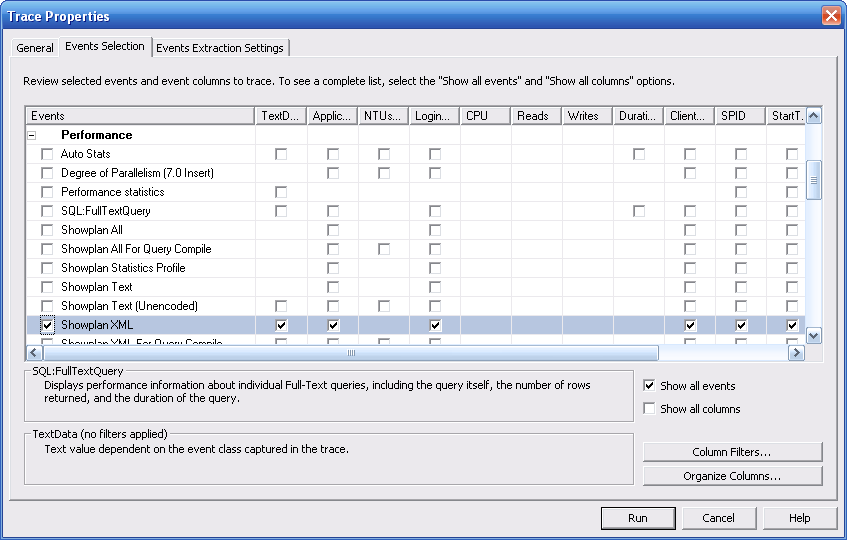
Clcik on TAB “EVENT selection” to enable TRACE for a specific Event. There are tonnes of them.
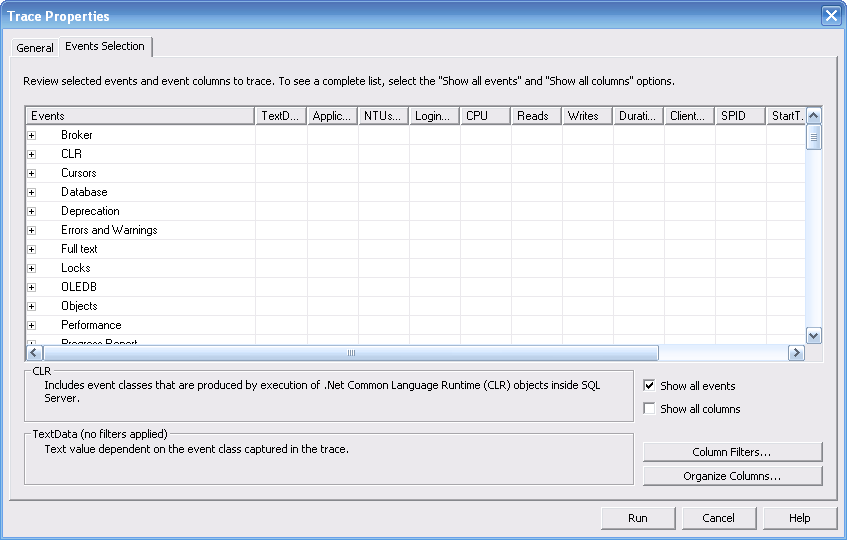
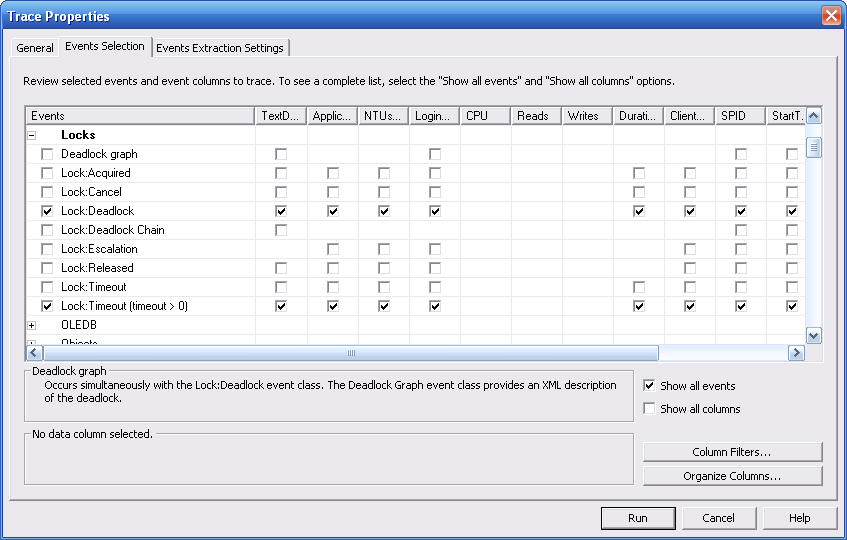
Let’s also select some locks to get stats on
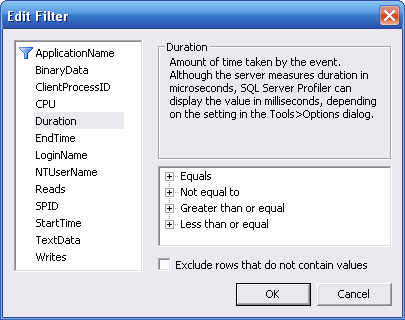
Click on any column like Reads/Writes/Duration to enter criteria which would filter results
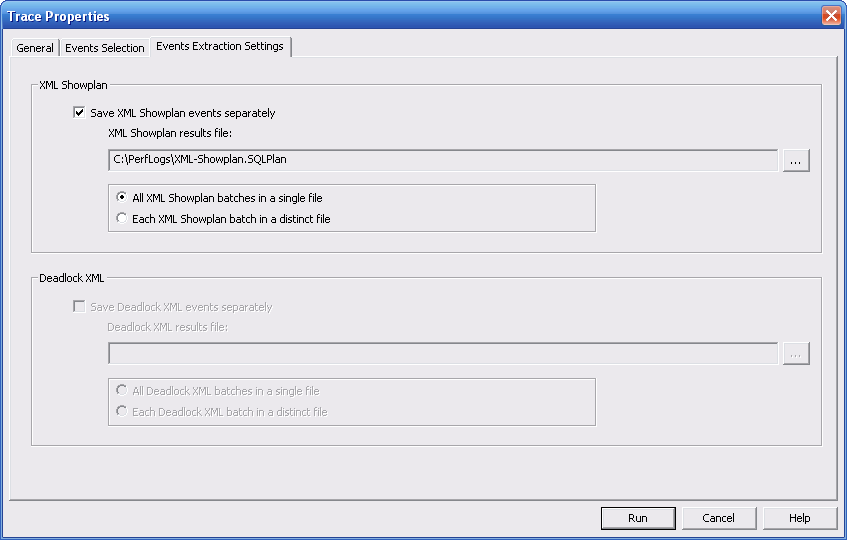
Let’s collect all SQL showplans in an XML file.
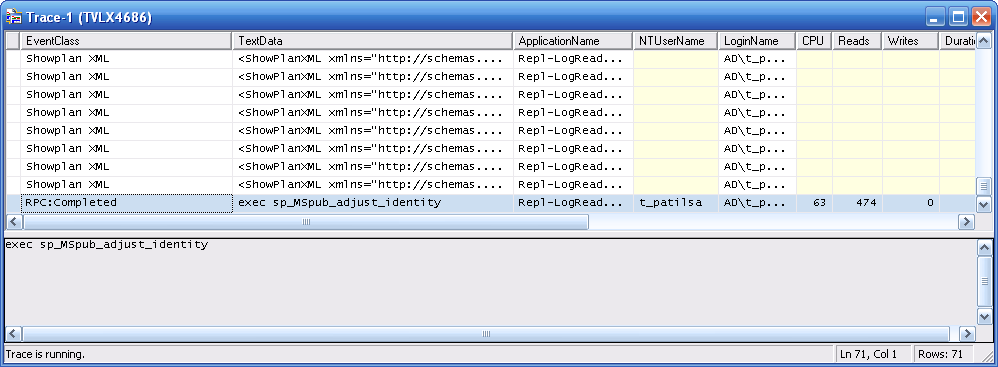
Hit RUN and the trace window would look like one below :
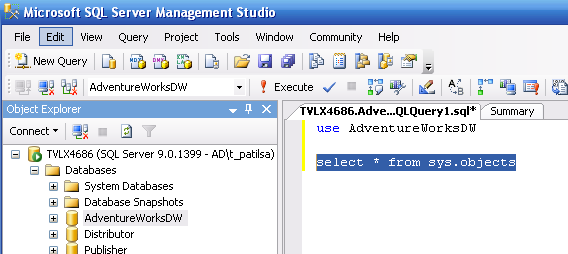
Let’s start a management studio and fire an SQL to see if profiler traps details for our SQL
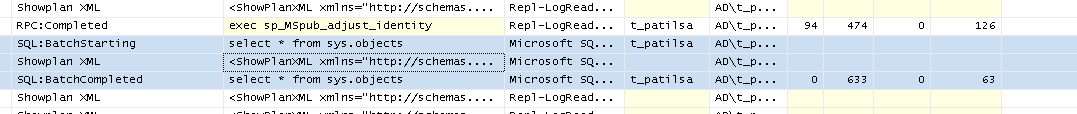
Now I can see at trace my statements
Let’s stop trace and look at SQL execution plans. Open file “C:\PerfLogs\XML-Showplan.SQLPlan” and you can see the statemnts and all execution plans in this fille. One can use a 3rd party tools to dig details.
Leave a Reply
You must be logged in to post a comment.