Tweet
Tweet
SQL Queries for DMVs

INDEX DMVs
1. Find fill factor of the indexes on the tables in the current databas
SELECT DB_NAME() AS DatabaseName
, SCHEMA_NAME(o.Schema_ID) AS SchemaName
, OBJECT_NAME(s.[object_id]) AS TableName
, i.name AS IndexName
, i.fill_factor
FROM sys.dm_db_index_usage_stats s
INNER JOIN sys.indexes i ON s.[object_id] = i.[object_id]
AND s.index_id = i.index_id
INNER JOIN sys.objects o ON i.object_id = O.object_id
WHERE s.database_id = DB_ID()
AND i.name IS NOT NULL
AND OBJECTPROPERTY(s.[object_id], 'IsMsShipped') = 0
ORDER BY fill_factor DESC
2. Locate fragmentation percentage of the indexes on a table within a database named warehousedw
SELECT i.name AS IndexName
, ROUND(s.avg_fragmentation_in_percent,2) AS [Fragmentation %]
FROM sys.dm_db_index_physical_stats(DB_ID(‘warehousedw’),
OBJECT_ID('table'), NULL, NULL, NULL) s
INNER JOIN sys.indexes i ON s.[object_id] = i.[object_id]
ANDs.index_id = i.index_id
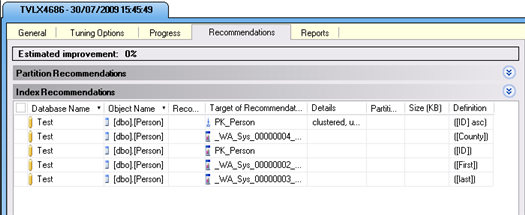
3. Identifying the most important missing indexes
SET TRANSACTION ISOLATION LEVEL READ UNCOMMITTED
SELECT TOP 20
ROUND(s.avg_total_user_cost *
s.avg_user_impact
* (s.user_seeks + s.user_scans),0)
AS [Total Cost]
, d.[statement] AS [Table Name]
, equality_columns
, inequality_columns
, included_columns
FROM sys.dm_db_missing_index_groups g
INNER JOIN sys.dm_db_missing_index_group_stats s
ON s.group_handle = g.index_group_handle
INNER JOIN sys.dm_db_missing_index_details d
ON d.index_handle = g.index_handle
ORDER BY [Total Cost] DESC
4. The most-costly unused indexes
SET TRANSACTION ISOLATION LEVEL READ UNCOMMITTED
SELECT
DB_NAME() AS DatabaseName
, SCHEMA_NAME(o.Schema_ID) AS SchemaName
, OBJECT_NAME(s.[object_id]) AS TableName
, i.name AS IndexName
, s.user_updates
, s.system_seeks + s.system_scans + s.system_lookups
AS [System usage]
INTO #TempUnusedIndexes
FROM sys.dm_db_index_usage_stats s
INNER JOIN sys.indexes i ON s.[object_id] = i.[object_id]
AND s.index_id = i.index_id
INNER JOIN sys.objects o ON i.object_id = O.object_id
WHERE 1=2
EXEC sp_MSForEachDB 'USE [?]; INSERT INTO #TempUnusedIndexes SELECT TOP 20 DB_NAME() AS DatabaseName , SCHEMA_NAME(o.Schema_ID) AS SchemaName , OBJECT_NAME(s.[object_id]) AS TableName , i.name AS IndexName , s.user_updates , s.system_seeks + s.system_scans + s.system_lookups AS [System usage] FROM sys.dm_db_index_usage_stats s INNER JOIN sys.indexes i ON s.[object_id] = i.[object_id] AND s.index_id = i.index_id INNER JOIN sys.objects o ON i.object_id = O.object_id WHERE s.database_id = DB_ID() AND OBJECTPROPERTY(s.[object_id], ''IsMsShipped'') = 0 AND s.user_seeks = 0 AND s.user_scans = 0 AND s.user_lookups = 0 AND i.name IS NOT NULL ORDER BY s.user_updates DESC'
SELECT TOP 20 * FROM #TempUnusedIndexes ORDER BY [user_updates] DESC
DROP TABLE #TempUnusedIndexes
5. Finding the top high-maintenance indexes
SET TRANSACTION ISOLATION LEVEL READ UNCOMMITTED
SELECT
DB_NAME() AS DatabaseName
, SCHEMA_NAME(o.Schema_ID) AS SchemaName
, OBJECT_NAME(s.[object_id]) AS TableName
, i.name AS IndexName
, (s.user_updates ) AS [update usage]
, (s.user_seeks + s.user_scans + s.user_lookups)
AS [Retrieval usage]
, (s.user_updates) -
(s.user_seeks + s.user_scans + s.user_lookups) AS [Maintenance cost]
, s.system_seeks + s.system_scans + s.system_lookups AS [System usage]
, s.last_user_seek
, s.last_user_scan
, s.last_user_lookup
INTO #TempMaintenanceCost
FROM sys.dm_db_index_usage_stats s
INNER JOIN sys.indexes i ON s.[object_id] = i.[object_id]
AND s.index_id = i.index_id
INNER JOIN sys.objects o ON i.object_id = O.object_id
WHERE 1=2
EXEC sp_MSForEachDB 'USE [?]; INSERT INTO #TempMaintenanceCost SELECT TOP 20 DB_NAME() AS DatabaseName , SCHEMA_NAME(o.Schema_ID) AS SchemaName , OBJECT_NAME(s.[object_id]) AS TableName , i.name AS IndexName , (s.user_updates ) AS [update usage] , (s.user_seeks + s.user_scans + s.user_lookups) AS [Retrieval usage] , (s.user_updates) - (s.user_seeks + user_scans + s.user_lookups) AS [Maintenance cost] , s.system_seeks + s.system_scans + s.system_lookups AS [System usage] , s.last_user_seek , s.last_user_scan , s.last_user_lookup FROM sys.dm_db_index_usage_stats s INNER JOIN sys.indexes i ON s.[object_id] = i.[object_id] AND s.index_id = i.index_id INNER JOIN sys.objects o ON i.object_id = O.object_id WHERE s.database_id = DB_ID() AND i.name IS NOT NULL AND OBJECTPROPERTY(s.[object_id], ''IsMsShipped'') = 0 AND (s.user_seeks + s.user_scans + s.user_lookups) > 0 ORDER BY [Maintenance cost] DESC'
SELECT top 20 * FROM #TempMaintenanceCost ORDER BY [Maintenance cost] DESC
DROP TABLE #TempMaintenanceCost
6. Finding the most-used indexes
SET TRANSACTION ISOLATION LEVEL READ UNCOMMITTED
SELECT
DB_NAME() AS DatabaseName
, SCHEMA_NAME(o.Schema_ID) AS SchemaName
, OBJECT_NAME(s.[object_id]) AS TableName
, i.name AS IndexName
, (s.user_seeks + s.user_scans + s.user_lookups) AS [Usage]
, s.user_updates
, i.fill_factor
INTO #TempUsage
FROM sys.dm_db_index_usage_stats s
INNER JOIN sys.indexes i ON s.[object_id] = i.[object_id]
AND s.index_id = i.index_id
INNER JOIN sys.objects o ON i.object_id = O.object_id
WHERE 1=2
EXEC sp_MSForEachDB 'USE [?]; INSERT INTO #TempUsage SELECT TOP 20 DB_NAME() AS DatabaseName , SCHEMA_NAME(o.Schema_ID) AS SchemaName , OBJECT_NAME(s.[object_id]) AS TableName , i.name AS IndexName , (s.user_seeks + s.user_scans + s.user_lookups) AS [Usage] , s.user_updates , i.fill_factor FROM sys.dm_db_index_usage_stats s INNER JOIN sys.indexes i ON s.[object_id] = i.[object_id] AND s.index_id = i.index_id INNER JOIN sys.objects o ON i.object_id = O.object_id WHERE s.database_id = DB_ID() AND i.name IS NOT NULL AND OBJECTPROPERTY(s.[object_id], ''IsMsShipped'') = 0 ORDER BY [Usage] DESC'
SELECT TOP 20 * FROM #TempUsage ORDER BY [Usage] DESC
DROP TABLE #TempUsage
7. Finding the most-fragmented indexes
SET TRANSACTION ISOLATION LEVEL READ UNCOMMITTED
SELECT
DB_NAME() AS DatbaseName
, SCHEMA_NAME(o.Schema_ID) AS SchemaName
, OBJECT_NAME(s.[object_id]) AS TableName
, i.name AS IndexName
, ROUND(s.avg_fragmentation_in_percent,2) AS [Fragmentation %]
INTO #TempFragmentation
FROM sys.dm_db_index_physical_stats(db_id(),null, null, null, null) s
INNER JOIN sys.indexes i ON s.[object_id] = i.[object_id]
AND s.index_id = i.index_id
INNER JOIN sys.objects o ON i.object_id = O.object_id
WHERE 1=2
EXEC sp_MSForEachDB 'USE [?]; INSERT INTO #TempFragmentation SELECT TOP 20 DB_NAME() AS DatbaseName , SCHEMA_NAME(o.Schema_ID) AS SchemaName , OBJECT_NAME(s.[object_id]) AS TableName , i.name AS IndexName , ROUND(s.avg_fragmentation_in_percent,2) AS [Fragmentation %] FROM sys.dm_db_index_physical_stats(db_id(),null, null, null, null) s INNER JOIN sys.indexes i ON s.[object_id] = i.[object_id] AND s.index_id = i.index_id INNER JOIN sys.objects o ON i.object_id = O.object_id WHERE s.database_id = DB_ID() AND i.name IS NOT NULL AND OBJECTPROPERTY(s.[object_id], ''IsMsShipped'') = 0 ORDER BY [Fragmentation %] DESC'
SELECT top 20 * FROM #TempFragmentation ORDER BY [Fragmentation %] DESC
DROP TABLE #TempFragmentation
8. The databases with the most missing indexes
SET TRANSACTION ISOLATION LEVEL READ UNCOMMITTED
SELECT
DB_NAME(database_id) AS DatabaseName
, COUNT(*) AS [Missing Index Count]
FROM sys.dm_db_missing_index_details
GROUP BY DB_NAME(database_id)
ORDER BY [Missing Index Count] DESC
9. Indexes that aren’t used at all
SET TRANSACTION ISOLATION LEVEL READ UNCOMMITTED
SELECT
DB_NAME() AS DatbaseName
, SCHEMA_NAME(O.Schema_ID) AS SchemaName
, OBJECT_NAME(I.object_id) AS TableName
, I.name AS IndexName
INTO #TempNeverUsedIndexes
FROM sys.indexes I INNER JOIN sys.objects O ON I.object_id = O.object_id
WHERE 1=2
EXEC sp_MSForEachDB 'USE [?]; INSERT INTO #TempNeverUsedIndexes SELECT DB_NAME() AS DatbaseName , SCHEMA_NAME(O.Schema_ID) AS SchemaName , OBJECT_NAME(I.object_id) AS TableName , I.NAME AS IndexName FROM sys.indexes I INNER JOIN sys.objects O ON I.object_id = O.object_id LEFT OUTER JOIN sys.dm_db_index_usage_stats S ON S.object_id = I.object_id AND I.index_id = S.index_id AND DATABASE_ID = DB_ID() WHERE OBJECTPROPERTY(O.object_id,''IsMsShipped'') = 0 AND I.name IS NOT NULL AND S.object_id IS NULL'
SELECT * FROM #TempNeverUsedIndexes
ORDER BY DatbaseName, SchemaName, TableName, IndexName
DROP TABLE #TempNeverUsedIndexes
10. Finding the state of your statistics
SET TRANSACTION ISOLATION LEVEL READ UNCOMMITTED
SELECT
ss.name AS SchemaName
, st.name AS TableName
, s.name AS IndexName
, STATS_DATE(s.id,s.indid) AS 'Statistics Last Updated'
, s.rowcnt AS 'Row Count'
, s.rowmodctr AS 'Number Of Changes'
, CAST((CAST(s.rowmodctr AS DECIMAL(28,8))/CAST(s.rowcnt AS
DECIMAL(28,2)) * 100.0)
AS DECIMAL(28,2)) AS '% Rows Changed'
FROM sys.sysindexes s
INNER JOIN sys.tables st ON st.[object_id] = s.[id]
INNER JOIN sys.schemas ss ON ss.[schema_id] = st.[schema_id]
WHERE s.id > 100
AND s.indid > 0
AND s.rowcnt >= 500
ORDER BY SchemaName, TableName, IndexName
QUERY DMVs
11. How to find a cached plan
SET TRANSACTION ISOLATION LEVEL READ UNCOMMITTED
SELECT TOP 20
st.text AS [SQL]
, cp.cacheobjtype
, cp.objtype
, COALESCE(DB_NAME(st.dbid),
DB_NAME(CAST(pa.value AS INT))+'*',
'Resource') AS [DatabaseName]
, cp.usecounts AS [Plan usage]
, qp.query_plan
FROM sys.dm_exec_cached_plans cp
CROSS APPLY sys.dm_exec_sql_text(cp.plan_handle) st
CROSS APPLY sys.dm_exec_query_plan(cp.plan_handle) qp
OUTER APPLY sys.dm_exec_plan_attributes(cp.plan_handle) pa
WHERE pa.attribute = 'dbid'
AND st.text LIKE '%PartyType%'
12. Finding where a query is used
SET TRANSACTION ISOLATION LEVEL READ UNCOMMITTED
SELECT TOP 20
SUBSTRING (qt.text,(qs.statement_start_offset/2) + 1,
((CASE WHEN qs.statement_end_offset = -1
THEN LEN(CONVERT(NVARCHAR(MAX), qt.text)) * 2
ELSE qs.statement_end_offset
END - qs.statement_start_offset)/2) + 1) AS [Individual Query]
, qt.text AS [Parent Query]
, DB_NAME(qt.dbid) AS DatabaseName
, qp.query_plan
FROM sys.dm_exec_query_stats qs
CROSS APPLY sys.dm_exec_sql_text(qs.sql_handle) as qt
CROSS APPLY sys.dm_exec_query_plan(qs.plan_handle) qp
WHERE SUBSTRING (qt.text,(qs.statement_start_offset/2) + 1,
((CASE WHEN qs.statement_end_offset = -1
THEN LEN(CONVERT(NVARCHAR(MAX), qt.text)) * 2
ELSE qs.statement_end_offset
END - qs.statement_start_offset)/2) + 1)
LIKE '%insert into dbo.deal%'
13. The queries that take the longest time to run
SET TRANSACTION ISOLATION LEVEL READ UNCOMMITTED
SELECT TOP 20
CAST(qs.total_elapsed_time / 1000000.0 AS DECIMAL(28, 2))
AS [Total Duration (s)]
, CAST(qs.total_worker_time * 100.0 / qs.total_elapsed_time
AS DECIMAL(28, 2)) AS [% CPU]
, CAST((qs.total_elapsed_time - qs.total_worker_time)* 100.0 /
qs.total_elapsed_time AS DECIMAL(28, 2)) AS [% Waiting]
, qs.execution_count
, CAST(qs.total_elapsed_time / 1000000.0 / qs.execution_count
AS DECIMAL(28, 2)) AS [Average Duration (s)]
, SUBSTRING (qt.text,(qs.statement_start_offset/2) + 1,
((CASE WHEN qs.statement_end_offset = -1
THEN LEN(CONVERT(NVARCHAR(MAX), qt.text)) * 2
ELSE qs.statement_end_offset
END - qs.statement_start_offset)/2) + 1) AS [Individual Query]
, qt.text AS [Parent Query]
, DB_NAME(qt.dbid) AS DatabaseName
, qp.query_plan
FROM sys.dm_exec_query_stats qs
CROSS APPLY sys.dm_exec_sql_text(qs.sql_handle) as qt
CROSS APPLY sys.dm_exec_query_plan(qs.plan_handle) qp
WHERE qs.total_elapsed_time > 0
ORDER BY qs.total_elapsed_time DESC
14. The queries spend the longest time being blocked
SET TRANSACTION ISOLATION LEVEL READ UNCOMMITTED
SELECT TOP 20
CAST((qs.total_elapsed_time - qs.total_worker_time) /
1000000.0 AS DECIMAL(28,2)) AS [Total time blocked (s)]
, CAST(qs.total_worker_time * 100.0 / qs.total_elapsed_time
AS DECIMAL(28,2)) AS [% CPU]
, CAST((qs.total_elapsed_time - qs.total_worker_time)* 100.0 /
qs.total_elapsed_time AS DECIMAL(28, 2)) AS [% Waiting]
, qs.execution_count
, CAST((qs.total_elapsed_time - qs.total_worker_time) / 1000000.0
/ qs.execution_count AS DECIMAL(28, 2)) AS [Blocking average (s)]
, SUBSTRING (qt.text,(qs.statement_start_offset/2) + 1,
((CASE WHEN qs.statement_end_offset = -1
THEN LEN(CONVERT(NVARCHAR(MAX), qt.text)) * 2
ELSE qs.statement_end_offset
END - qs.statement_start_offset)/2) + 1) AS [Individual Query]
, qt.text AS [Parent Query]
, DB_NAME(qt.dbid) AS DatabaseName
, qp.query_plan
FROM sys.dm_exec_query_stats qs
CROSS APPLY sys.dm_exec_sql_text(qs.sql_handle) as qt
CROSS APPLY sys.dm_exec_query_plan(qs.plan_handle) qp
WHERE qs.total_elapsed_time > 0
ORDER BY [Total time blocked (s)] DESC
15. The queries that use the most CPU
SET TRANSACTION ISOLATION LEVEL READ UNCOMMITTED
SELECT TOP 20
CAST((qs.total_worker_time) / 1000000.0 AS DECIMAL(28,2))
AS [Total CPU time (s)]
, CAST(qs.total_worker_time * 100.0 / qs.total_elapsed_time
AS DECIMAL(28,2)) AS [% CPU]
, CAST((qs.total_elapsed_time - qs.total_worker_time)* 100.0 /
qs.total_elapsed_time AS DECIMAL(28, 2)) AS [% Waiting]
, qs.execution_count
, CAST((qs.total_worker_time) / 1000000.0
/ qs.execution_count AS DECIMAL(28, 2)) AS [CPU time average (s)]
, SUBSTRING (qt.text,(qs.statement_start_offset/2) + 1,
((CASE WHEN qs.statement_end_offset = -1
THEN LEN(CONVERT(NVARCHAR(MAX), qt.text)) * 2
ELSE qs.statement_end_offset
END - qs.statement_start_offset)/2) + 1) AS [Individual Query]
, qt.text AS [Parent Query]
, DB_NAME(qt.dbid) AS DatabaseName
, qp.query_plan
FROM sys.dm_exec_query_stats qs
CROSS APPLY sys.dm_exec_sql_text(qs.sql_handle) as qt
CROSS APPLY sys.dm_exec_query_plan(qs.plan_handle) qp
WHERE qs.total_elapsed_time > 0
ORDER BY [Total CPU time (s)] DESC
16. The queries that use the most I/O
SET TRANSACTION ISOLATION LEVEL READ UNCOMMITTED
SELECT TOP 20
[Total IO] = (qs.total_logical_reads + qs.total_logical_writes)
, [Average IO] = (qs.total_logical_reads + qs.total_logical_writes) /
qs.execution_count
, qs.execution_count
, SUBSTRING (qt.text,(qs.statement_start_offset/2) + 1,
((CASE WHEN qs.statement_end_offset = -1
THEN LEN(CONVERT(NVARCHAR(MAX), qt.text)) * 2
ELSE qs.statement_end_offset
END - qs.statement_start_offset)/2) + 1) AS [Individual Query]
, qt.text AS [Parent Query]
, DB_NAME(qt.dbid) AS DatabaseName
, qp.query_plan
FROM sys.dm_exec_query_stats qs
CROSS APPLY sys.dm_exec_sql_text(qs.sql_handle) as qt
CROSS APPLY sys.dm_exec_query_plan(qs.plan_handle) qp
ORDER BY [Total IO] DESC
17. The queries that have been executed the most often
SET TRANSACTION ISOLATION LEVEL READ UNCOMMITTED
SELECT TOP 20
qs.execution_count
, SUBSTRING (qt.text,(qs.statement_start_offset/2) + 1,
((CASE WHEN qs.statement_end_offset = -1
THEN LEN(CONVERT(NVARCHAR(MAX), qt.text)) * 2
ELSE qs.statement_end_offset
END - qs.statement_start_offset)/2) + 1) AS [Individual Query]
, qt.text AS [Parent Query]
, DB_NAME(qt.dbid) AS DatabaseName
, qp.query_plan
FROM sys.dm_exec_query_stats qs
CROSS APPLY sys.dm_exec_sql_text(qs.sql_handle) as qt
CROSS APPLY sys.dm_exec_query_plan(qs.plan_handle) qp
ORDER BY qs.execution_count DESC;
18. Finding when a query was last run
SET TRANSACTION ISOLATION LEVEL READ UNCOMMITTED
SELECT DISTINCT TOP 20
qs.last_execution_time
, qt.text AS [Parent Query]
, DB_NAME(qt.dbid) AS DatabaseName
FROM sys.dm_exec_query_stats qs
CROSS APPLY sys.dm_exec_sql_text(qs.sql_handle) as qt
WHERE qt.text LIKE '%CREATE PROCEDURE%List%PickList%'
ORDER BY qs.last_execution_time DESC
19. Finding when a table was last inserted
SET TRANSACTION ISOLATION LEVEL READ UNCOMMITTED
SELECT TOP 20
qs.last_execution_time
, SUBSTRING (qt.text,(qs.statement_start_offset/2) + 1,
((CASE WHEN qs.statement_end_offset = -1
THEN LEN(CONVERT(NVARCHAR(MAX), qt.text)) * 2
ELSE qs.statement_end_offset
END - qs.statement_start_offset)/2) + 1) AS [Individual Query]
, qt.text AS [Parent Query]
, DB_NAME(qt.dbid) AS DatabaseName
FROM sys.dm_exec_query_stats qs
CROSS APPLY sys.dm_exec_sql_text(qs.sql_handle) as qt
WHERE SUBSTRING (qt.text,(qs.statement_start_offset/2) + 1,
((CASE WHEN qs.statement_end_offset = -1
THEN LEN(CONVERT(NVARCHAR(MAX), qt.text)) * 2
ELSE qs.statement_end_offset
END - qs.statement_start_offset)/2) + 1)
LIKE '%INSERT INTO dbo.Underlying%'
ORDER BY qs.last_execution_time DESC
The listing is very similar to the other scripts
20. Finding queries with missing statistics
SET TRANSACTION ISOLATION LEVEL READ UNCOMMITTED
SELECT TOP 20
st.text AS [Parent Query]
, DB_NAME(st.dbid)AS [DatabaseName]
, cp.usecounts AS [Usage Count]
, qp.query_plan
FROM sys.dm_exec_cached_plans cp
CROSS APPLY sys.dm_exec_sql_text(cp.plan_handle) st
CROSS APPLY sys.dm_exec_query_plan(cp.plan_handle) qp
WHERE CAST(qp.query_plan AS NVARCHAR(MAX))
LIKE '%<ColumnsWithNoStatistics>%'
ORDER BY cp.usecounts DESC
21. Finding your default statistics options
SET TRANSACTION ISOLATION LEVEL READ UNCOMMITTED
SELECT name AS DatabaseName
, is_auto_create_stats_on AS AutoCreateStatistics
, is_auto_update_stats_on AS AutoUpdateStatistics
, is_auto_update_stats_async_on
AS AutoUpdateStatisticsAsync
FROM sys.databases
ORDER BY DatabaseName
22. Finding disparate columns with different data types
SET TRANSACTION ISOLATION LEVEL READ UNCOMMITTED
SELECT
COLUMN_NAME
,[%] = CONVERT(DECIMAL(12,2),COUNT(COLUMN_NAME)*
100.0 / COUNT(*)OVER())
INTO #Prevalence
FROM INFORMATION_SCHEMA.COLUMNS
GROUP BY COLUMN_NAME
SELECT DISTINCT
C1.COLUMN_NAME
, C1.TABLE_SCHEMA
, C1.TABLE_NAME
, C1.DATA_TYPE
, C1.CHARACTER_MAXIMUM_LENGTH
, C1.NUMERIC_PRECISION
, C1.NUMERIC_SCALE
, [%]
FROM INFORMATION_SCHEMA.COLUMNS C1
INNER JOIN INFORMATION_SCHEMA.COLUMNS C2 ON C1.COLUMN_NAME =
C2.COLUMN_NAME
INNER JOIN #Prevalence p ON p.COLUMN_NAME = C1.COLUMN_NAME
WHERE ((C1.DATA_TYPE != C2.DATA_TYPE)
OR (C1.CHARACTER_MAXIMUM_LENGTH != C2.CHARACTER_MAXIMUM_LENGTH)
OR (C1.NUMERIC_PRECISION != C2.NUMERIC_PRECISION)
OR (C1.NUMERIC_SCALE != C2.NUMERIC_SCALE))
ORDER BY [%] DESC, C1.COLUMN_NAME, C1.TABLE_SCHEMA, C1.TABLE_NAME
DROP TABLE #Prevalence
23. Finding queries that are running slower than normal
SET TRANSACTION ISOLATION LEVEL READ UNCOMMITTED
SELECT TOP 100
qs.execution_count AS [Runs]
, (qs.total_worker_time - qs.last_worker_time) / (qs.execution_count - 1)
AS [Avg time]
, qs.last_worker_time AS [Last time]
, (qs.last_worker_time - ((qs.total_worker_time - qs.last_worker_time) /
(qs.execution_count - 1))) AS [Time Deviation]
, CASE WHEN qs.last_worker_time = 0
THEN 100
ELSE (qs.last_worker_time - ((qs.total_worker_time -
qs.last_worker_time) / (qs.execution_count - 1))) * 100
END
/ (((qs.total_worker_time - qs.last_worker_time) /
(qs.execution_count - 1.0))) AS [% Time Deviation]
,qs.last_logical_reads + qs.last_logical_writes + qs.last_physical_reads
AS [Last IO]
, ((qs.total_logical_reads + qs.total_logical_writes +
qs.total_physical_reads) -
(qs.last_logical_reads + last_logical_writes
+ qs.last_physical_reads))
/ (qs.execution_count - 1) AS [Avg IO]
, SUBSTRING (qt.text,(qs.statement_start_offset/2) + 1,
((CASE WHEN qs.statement_end_offset = -1
THEN LEN(CONVERT(NVARCHAR(MAX), qt.text)) * 2
ELSE qs.statement_end_offset
END - qs.statement_start_offset)/2) + 1) AS [Individual Query]
, qt.text AS [Parent Query]
, DB_NAME(qt.dbid) AS [DatabaseName]
INTO #SlowQueries
FROM sys.dm_exec_query_stats qs
CROSS APPLY sys.dm_exec_sql_text(qs.plan_handle) qt
WHERE qs.execution_count > 1
AND qs.total_worker_time != qs.last_worker_time
ORDER BY [% Time Deviation] DESC
SELECT TOP 100 [Runs]
, [Avg time]
, [Last time]
, [Time Deviation]
, [% Time Deviation]
, [Last IO]
, [Avg IO]
, [Last IO] - [Avg IO] AS [IO Deviation]
, CASE WHEN [Avg IO] = 0
THEN 0
ELSE ([Last IO]- [Avg IO]) * 100 / [Avg IO]
END AS [% IO Deviation]
, [Individual Query]
, [Parent Query]
, [DatabaseName]
INTO #SlowQueriesByIO
FROM #SlowQueries
ORDER BY [% Time Deviation] DESC
SELECT TOP 100
[Runs]
, [Avg time]
, [Last time]
, [Time Deviation]
, [% Time Deviation]
, [Last IO]
, [Avg IO]
, [IO Deviation]
, [% IO Deviation]
, [Impedance] = [% Time Deviation] - [% IO Deviation]
, [Individual Query]
, [Parent Query]
, [DatabaseName]
FROM #SlowQueriesByIO
WHERE [% Time Deviation] - [% IO Deviation] > 20
ORDER BY [Impedance] DESC
DROP TABLE #SlowQueries
DROP TABLE #SlowQueriesByIO
24. Finding unused stored procedures
SET TRANSACTION ISOLATION LEVEL READ UNCOMMITTED
SELECT s.name, s.type_desc
FROM sys.procedures s
LEFT OUTER JOIN sys.dm_exec_procedure_stats d
ON s.object_id = d.object_id
WHERE d.object_id IS NULL
ORDER BY s.name
25. Which queries run over a given time period
SET TRANSACTION ISOLATION LEVEL READ UNCOMMITTED
SELECT sql_handle, plan_handle, total_elapsed_time
, total_worker_time, total_logical_reads, total_logical_writes
, total_clr_time, execution_count, statement_start_offset
, statement_end_offset
INTO #PreWorkSnapShot
FROM sys.dm_exec_query_stats
WAITFOR DELAY '00:05:00'
SELECT sql_handle, plan_handle, total_elapsed_time
, total_worker_time, total_logical_reads, total_logical_writes
, total_clr_time, execution_count, statement_start_offset
, statement_end_offset
INTO #PostWorkSnapShot
FROM sys.dm_exec_query_stats
SELECT
p2.total_elapsed_time - ISNULL(p1.total_elapsed_time, 0) AS [Duration]
, p2.total_worker_time - ISNULL(p1.total_worker_time, 0) AS [Time on CPU]
, (p2.total_elapsed_time - ISNULL(p1.total_elapsed_time, 0)) -
(p2.total_worker_time - ISNULL(p1.total_worker_time, 0))
AS [Time blocked]
, p2.total_logical_reads - ISNULL(p1.total_logical_reads, 0) AS [Reads]
, p2.total_logical_writes - ISNULL(p1.total_logical_writes, 0)
AS [Writes]
, p2.total_clr_time - ISNULL(p1.total_clr_time, 0) AS [CLR time]
, p2.execution_count - ISNULL(p1.execution_count, 0) AS [Executions]
, SUBSTRING (qt.text,p2.statement_start_offset/2 + 1,
((CASE WHEN p2.statement_end_offset = -1
THEN LEN(CONVERT(NVARCHAR(MAX), qt.text)) * 2
ELSE p2.statement_end_offset
END - p2.statement_start_offset)/2) + 1) AS [Individual Query]
, qt.text AS [Parent Query]
, DB_NAME(qt.dbid) AS DatabaseName
, qp.query_plan
FROM #PreWorkSnapShot p1
RIGHT OUTER JOIN
#PostWorkSnapShot p2 ON p2.sql_handle =
ISNULL(p1.sql_handle, p2.sql_handle)
AND p2.plan_handle = ISNULL(p1.plan_handle, p2.plan_handle)
AND p2.statement_start_offset =
ISNULL(p1.statement_start_offset, p2.statement_start_offset)
AND p2.statement_end_offset =
ISNULL(p1.statement_end_offset, p2.statement_end_offset)
CROSS APPLY sys.dm_exec_sql_text(p2.sql_handle) as qt
CROSS APPLY sys.dm_exec_query_plan(p2.plan_handle) qp
WHERE p2.execution_count != ISNULL(p1.execution_count, 0)
AND qt.text NOT LIKE '--ThisRoutineIdentifier99%'
ORDER BY [Duration] DESC
DROP TABLE #PreWorkSnapShot
DROP TABLE #PostWorkSnapShot
26. Amalgamated DMV snapshots
--ThisRoutineIdentifier
SET TRANSACTION ISOLATION LEVEL READ UNCOMMITTED
SELECT
index_group_handle, index_handle
, avg_total_user_cost, avg_user_impact, user_seeks, user_scans
INTO #PreWorkMissingIndexes
FROM sys.dm_db_missing_index_groups g
INNER JOIN sys.dm_db_missing_index_group_stats s
ON s.group_handle = g.index_group_handle
SELECT
sql_handle, plan_handle, total_elapsed_time, total_worker_time
, total_logical_reads, total_logical_writes, total_clr_time
, execution_count, statement_start_offset, statement_end_offset
INTO #PreWorkQuerySnapShot
FROM sys.dm_exec_query_stats
SELECT
[object_name], [counter_name], [instance_name]
, [cntr_value], [cntr_type]
INTO #PreWorkOSSnapShot
FROM sys.dm_os_performance_counters
SELECT
wait_type, waiting_tasks_count
, wait_time_ms, max_wait_time_ms, signal_wait_time_ms
INTO #PreWorkWaitStats
FROM sys.dm_os_wait_stats
WAITFOR DELAY '00:05:00'
SELECT wait_type, waiting_tasks_count, wait_time_ms
, max_wait_time_ms, signal_wait_time_ms
INTO #PostWorkWaitStats
FROM sys.dm_os_wait_stats
SELECT [object_name], [counter_name], [instance_name]
, [cntr_value], [cntr_type]
INTO #PostWorkOSSnapShot
FROM sys.dm_os_performance_counters
SELECT sql_handle, plan_handle, total_elapsed_time, total_worker_time
, total_logical_reads, total_logical_writes, total_clr_time
, execution_count, statement_start_offset, statement_end_offset
INTO #PostWorkQuerySnapShot
FROM sys.dm_exec_query_stats
SELECT index_group_handle, index_handle
, avg_total_user_cost, avg_user_impact, user_seeks, user_scans
INTO #PostWorkMissingIndexes
FROM sys.dm_db_missing_index_groups g
INNER JOIN sys.dm_db_missing_index_group_stats s
ON s.group_handle = g.index_group_handle
SELECT
p2.total_elapsed_time - ISNULL(p1.total_elapsed_time, 0) AS [Duration]
, p2.total_worker_time - ISNULL(p1.total_worker_time, 0) AS [Time on CPU]
, (p2.total_elapsed_time - ISNULL(p1.total_elapsed_time, 0)) -
(p2.total_worker_time - ISNULL(p1.total_worker_time, 0))
AS [Time blocked]
, p2.total_logical_reads - ISNULL(p1.total_logical_reads, 0) AS [Reads]
, p2.total_logical_writes - ISNULL(p1.total_logical_writes, 0)
AS [Writes]
, p2.total_clr_time - ISNULL(p1.total_clr_time, 0) AS [CLR time]
, p2.execution_count - ISNULL(p1.execution_count, 0) AS [Executions]
, SUBSTRING (qt.text,p2.statement_start_offset/2 + 1,
((CASE WHEN p2.statement_end_offset = -1
THEN LEN(CONVERT(NVARCHAR(MAX), qt.text)) * 2
ELSE p2.statement_end_offset
END - p2.statement_start_offset)/2) + 1) AS [Individual Query]
, qt.text AS [Parent Query]
, DB_NAME(qt.dbid) AS DatabaseName
FROM #PreWorkQuerySnapShot p1
RIGHT OUTER JOIN
#PostWorkQuerySnapShot p2 ON p2.sql_handle =
ISNULL(p1.sql_handle, p2.sql_handle)
AND p2.plan_handle = ISNULL(p1.plan_handle, p2.plan_handle)
AND p2.statement_start_offset =
ISNULL(p1.statement_start_offset, p2.statement_start_offset)
AND p2.statement_end_offset =
ISNULL(p1.statement_end_offset, p2.statement_end_offset)
CROSS APPLY sys.dm_exec_sql_text(p2.sql_handle) as qt
WHERE p2.execution_count != ISNULL(p1.execution_count, 0)
AND qt.text NOT LIKE '--ThisRoutineIdentifier%'
SELECT
p2.wait_time_ms - ISNULL(p1.wait_time_ms, 0) AS wait_time_ms
, p2.signal_wait_time_ms - ISNULL(p1.signal_wait_time_ms, 0)
AS signal_wait_time_ms
, ((p2.wait_time_ms - ISNULL(p1.wait_time_ms, 0))
- (p2.signal_wait_time_ms
- ISNULL(p1.signal_wait_time_ms, 0))) AS RealWait
, p2.wait_type
FROM #PreWorkWaitStats p1
RIGHT OUTER JOIN
#PostWorkWaitStats p2 ON p2.wait_type = ISNULL(p1.wait_type, p2.wait_type)
WHERE p2.wait_time_ms - ISNULL(p1.wait_time_ms, 0) > 0
AND p2.wait_type NOT LIKE '%SLEEP%'
AND p2.wait_type != 'WAITFOR'
ORDER BY RealWait DESC
SELECT
ROUND((p2.avg_total_user_cost - ISNULL(p1.avg_total_user_cost, 0))
* (p2.avg_user_impact - ISNULL(p1.avg_user_impact, 0)) *
((p2.user_seeks - ISNULL(p1.user_seeks, 0))
+ (p2.user_scans - ISNULL(p1.user_scans, 0))),0)
AS [Total Cost]
, p2.avg_total_user_cost - ISNULL(p1.avg_total_user_cost, 0)
AS avg_total_user_cost
, p2.avg_user_impact - ISNULL(p1.avg_user_impact, 0) AS avg_user_impact
, p2.user_seeks - ISNULL(p1.user_seeks, 0) AS user_seeks
, p2.user_scans - ISNULL(p1.user_scans, 0) AS user_scans
, d.statement AS TableName
, d.equality_columns
, d.inequality_columns
, d.included_columns
FROM #PreWorkMissingIndexes p1
RIGHT OUTER JOIN
#PostWorkMissingIndexes p2 ON p2.index_group_handle =
ISNULL(p1.index_group_handle, p2.index_group_handle)
AND p2.index_handle =
ISNULL(p1.index_handle, p2.index_handle)
INNER JOIN sys.dm_db_missing_index_details d
ON p2.index_handle = d.index_handle
WHERE p2.avg_total_user_cost - ISNULL(p1.avg_total_user_cost, 0) > 0
OR p2.avg_user_impact - ISNULL(p1.avg_user_impact, 0) > 0
OR p2.user_seeks - ISNULL(p1.user_seeks, 0) > 0
OR p2.user_scans - ISNULL(p1.user_scans, 0) > 0
ORDER BY [Total Cost] DESC
SELECT
p2.object_name, p2.counter_name, p2.instance_name
, ISNULL(p1.cntr_value, 0) AS InitialValue
, p2.cntr_value AS FinalValue
, p2.cntr_value - ISNULL(p1.cntr_value, 0) AS Change
, (p2.cntr_value - ISNULL(p1.cntr_value, 0)) * 100 / p1.cntr_value
AS [% Change]
FROM #PreWorkOSSnapShot p1
RIGHT OUTER JOIN
#PostWorkOSSnapShot p2 ON p2.object_name =
ISNULL(p1.object_name, p2.object_name)
AND p2.counter_name = ISNULL(p1.counter_name, p2.counter_name)
AND p2.instance_name = ISNULL(p1.instance_name, p2.instance_name)
WHERE p2.cntr_value - ISNULL(p1.cntr_value, 0) > 0
AND ISNULL(p1.cntr_value, 0) != 0
ORDER BY [% Change] DESC, Change DESC
DROP TABLE #PreWorkQuerySnapShot
DROP TABLE #PostWorkQuerySnapShot
DROP TABLE #PostWorkWaitStats
DROP TABLE #PreWorkWaitStats
DROP TABLE #PreWorkOSSnapShot
DROP TABLE #PostWorkOSSnapShot
DROP TABLE #PreWorkMissingIndexes
DROP TABLE #PostWorkMissingIndexes
27. What queries are running now
SELECT
es.session_id, es.host_name, es.login_name
, er.status, DB_NAME(database_id) AS DatabaseName
, SUBSTRING (qt.text,(er.statement_start_offset/2) + 1,
((CASE WHEN er.statement_end_offset = -1
THEN LEN(CONVERT(NVARCHAR(MAX), qt.text)) * 2
ELSE er.statement_end_offset
END - er.statement_start_offset)/2) + 1) AS [Individual Query]
, qt.text AS [Parent Query]
, es.program_name, er.start_time, qp.query_plan
, er.wait_type, er.total_elapsed_time, er.cpu_time, er.logical_reads
, er.blocking_session_id, er.open_transaction_count, er.last_wait_type
, er.percent_complete
FROM sys.dm_exec_requests AS er
INNER JOIN sys.dm_exec_sessions AS es ON es.session_id = er.session_id
CROSS APPLY sys.dm_exec_sql_text( er.sql_handle) AS qt
CROSS APPLY sys.dm_exec_query_plan(er.plan_handle) qp
WHERE es.is_user_process=1
AND es.session_Id NOT IN (@@SPID)
ORDER BY es.session_id
28. Determining your most-recompiled queries
SET TRANSACTION ISOLATION LEVEL READ UNCOMMITTED
SELECT TOP 20
qs.plan_generation_num
, qs.total_elapsed_time
, qs.execution_count
, SUBSTRING (qt.text,(qs.statement_start_offset/2) + 1,
((CASE WHEN qs.statement_end_offset = -1
THEN LEN(CONVERT(NVARCHAR(MAX), qt.text)) * 2
ELSE qs.statement_end_offset
END - qs.statement_start_offset)/2) + 1) AS [Individual Query]
, qt.text AS [Parent Query], DB_NAME(qt.dbid) AS DatabaseName
, qs.creation_time
, qs.last_execution_time
FROM sys.dm_exec_query_stats qs
CROSS APPLY sys.dm_exec_sql_text(qs.sql_handle) as qt
ORDER BY plan_generation_num DESC
Operating system DMVs
29. SQL script shown here will identify the top 20 causes of waiting on your server instance
SET TRANSACTION ISOLATION LEVEL READ UNCOMMITTED
SELECT TOP 20
wait_type, wait_time_ms, signal_wait_time_ms
, wait_time_ms - signal_wait_time_ms AS RealWait
, CONVERT(DECIMAL(12,2), wait_time_ms * 100.0 / SUM(wait_time_ms) OVER())
AS [% Waiting]
, CONVERT(DECIMAL(12,2), (wait_time_ms - signal_wait_time_ms) * 100.0
/ SUM(wait_time_ms) OVER()) AS [% RealWait]
FROM sys.dm_os_wait_stats
WHERE wait_type NOT LIKE '%SLEEP%'
AND wait_type != 'WAITFOR'
ORDER BYwait_time_ms DESC
30. Script will identify the waits that occur over a given 10-minute period, ordered by RealWait
SET TRANSACTION ISOLATION LEVEL READ UNCOMMITTED
SELECT wait_type, waiting_tasks_count
, wait_time_ms, max_wait_time_ms, signal_wait_time_ms
INTO #PreWorkWaitStats
FROM sys.dm_os_wait_stats
WAITFOR DELAY '00:10:00'
SELECT wait_type, waiting_tasks_count
, wait_time_ms, max_wait_time_ms, signal_wait_time_ms
INTO #PostWorkWaitStats
FROM sys.dm_os_wait_stats
SELECT
p2.wait_time_ms - ISNULL(p1.wait_time_ms, 0) AS wait_time_ms
, p2.signal_wait_time_ms - ISNULL(p1.signal_wait_time_ms, 0)
AS signal_wait_time_ms
, ((p2.wait_time_ms - ISNULL(p1.wait_time_ms, 0))
- (p2.signal_wait_time_ms - ISNULL(p1.signal_wait_time_ms, 0)))
AS RealWait
, p2.wait_type
FROM #PreWorkWaitStats p1
RIGHT OUTER JOIN
#PostWorkWaitStats p2 ON p2.wait_type = ISNULL(p1.wait_type, p2.wait_type)
WHERE p2.wait_time_ms - ISNULL(p1.wait_time_ms, 0) > 0
AND p2.wait_type NOT LIKE '%SLEEP%'
AND p2.wait_type != 'WAITFOR'
ORDER BY RealWait DESC
DROP TABLE #PostWorkWaitStats
DROP TABLE #PreWorkWaitStats
31. Why your queries are waiting
--ThisRoutineIdentifier
SET TRANSACTION ISOLATION LEVEL READ UNCOMMITTED
SELECT
sql_handle, plan_handle, total_elapsed_time, total_worker_time
, total_logical_reads, total_logical_writes, total_clr_time
, execution_count, statement_start_offset, statement_end_offset
INTO #PreWorkQuerySnapShot
FROM sys.dm_exec_query_stats
SELECT
wait_type, waiting_tasks_count
, wait_time_ms, max_wait_time_ms, signal_wait_time_ms
INTO #PreWorkWaitStats
FROM sys.dm_os_wait_stats
WAITFOR DELAY '00:05:00'
SELECT
wait_type, waiting_tasks_count, wait_time_ms
, max_wait_time_ms, signal_wait_time_ms
INTO #PostWorkWaitStats
FROM sys.dm_os_wait_stats
SELECT
sql_handle, plan_handle, total_elapsed_time, total_worker_time
, total_logical_reads, total_logical_writes, total_clr_time
, execution_count, statement_start_offset, statement_end_offset
INTO #PostWorkQuerySnapShot
FROM sys.dm_exec_query_stats
SELECT
p2.wait_time_ms - ISNULL(p1.wait_time_ms, 0) AS wait_time_ms
, p2.signal_wait_time_ms - ISNULL(p1.signal_wait_time_ms, 0)
AS signal_wait_time_ms
, ((p2.wait_time_ms - ISNULL(p1.wait_time_ms, 0))
– (p2.signal_wait_time_ms - ISNULL(p1.signal_wait_time_ms, 0)))
AS RealWait
, p2.wait_type
FROM #PreWorkWaitStats p1
RIGHT OUTER JOIN
#PostWorkWaitStats p2 ON p2.wait_type = ISNULL(p1.wait_type, p2.wait_type)
WHERE p2.wait_time_ms - ISNULL(p1.wait_time_ms, 0) > 0
AND p2.wait_type NOT LIKE '%SLEEP%'
AND p2.wait_type != 'WAITFOR'
ORDER BY RealWait DESC
SELECT
p2.total_elapsed_time - ISNULL(p1.total_elapsed_time, 0) AS [Duration]
, p2.total_worker_time - ISNULL(p1.total_worker_time, 0) AS [Time on CPU]
, (p2.total_elapsed_time - ISNULL(p1.total_elapsed_time, 0)) -
(p2.total_worker_time - ISNULL(p1.total_worker_time, 0))
AS [Time blocked]
, p2.total_logical_reads - ISNULL(p1.total_logical_reads, 0) AS [Reads]
, p2.total_logical_writes - ISNULL(p1.total_logical_writes, 0)
AS [Writes]
, p2.total_clr_time - ISNULL(p1.total_clr_time, 0) AS [CLR time]
, p2.execution_count - ISNULL(p1.execution_count, 0) AS [Executions]
, SUBSTRING (qt.text,p2.statement_start_offset/2 + 1,
((CASE WHEN p2.statement_end_offset = -1
THEN LEN(CONVERT(NVARCHAR(MAX), qt.text)) * 2
ELSE p2.statement_end_offset
END - p2.statement_start_offset)/2) + 1) AS [Individual Query]
, qt.text AS [Parent Query]
, DB_NAME(qt.dbid) AS DatabaseName
FROM #PreWorkQuerySnapShot p1
RIGHT OUTER JOIN
#PostWorkQuerySnapShot p2 ON p2.sql_handle =
ISNULL(p1.sql_handle, p2.sql_handle)
AND p2.plan_handle = ISNULL(p1.plan_handle, p2.plan_handle)
AND p2.statement_start_offset =
ISNULL(p1.statement_start_offset, p2.statement_start_offset)
AND p2.statement_end_offset =
ISNULL(p1.statement_end_offset, p2.statement_end_offset)
CROSS APPLY sys.dm_exec_sql_text(p2.sql_handle) as qt
WHERE p2.execution_count != ISNULL(p1.execution_count, 0)
AND qt.text NOT LIKE '--ThisRoutineIdentifier%'
ORDER BY [Time blocked] DESC
DROP TABLE #PostWorkWaitStats
DROP TABLE #PreWorkWaitStats
DROP TABLE #PostWorkQuerySnapShot
DROP TABLE #PreWorkQuerySnapShot
32. What’s blocking my SQL query?
SELECT
Blocking.session_id as BlockingSessionId
, Sess.login_name AS BlockingUser
, BlockingSQL.text AS BlockingSQL
, Waits.wait_type WhyBlocked
, Blocked.session_id AS BlockedSessionId
, USER_NAME(Blocked.user_id) AS BlockedUser
, BlockedSQL.text AS BlockedSQL
, DB_NAME(Blocked.database_id) AS DatabaseName
FROM sys.dm_exec_connections AS Blocking
INNER JOIN sys.dm_exec_requests AS Blocked
ON Blocking.session_id = Blocked.blocking_session_id
INNER JOIN sys.dm_os_waiting_tasks AS Waits
ON Blocked.session_id = Waits.session_id
RIGHT OUTER JOIN sys.dm_exec_sessions Sess
ON Blocking.session_id = sess.session_id
CROSS APPLY sys.dm_exec_sql_text(Blocking.most_recent_sql_handle)
AS BlockingSQL
CROSS APPLY sys.dm_exec_sql_text(Blocked.sql_handle) AS BlockedSQL
ORDER BY BlockingSessionId, BlockedSessionId
33. Script here will show how the performance counters change over the given time interval.
SET TRANSACTION ISOLATION LEVEL READ UNCOMMITTED
SELECT
[object_name], [counter_name], [instance_name]
, [cntr_value], [cntr_type]
INTO #PreWorkOSSnapShot
FROM sys.dm_os_performance_counters
WAITFOR DELAY '00:05:00'
SELECT
[object_name], [counter_name], [instance_name]
, [cntr_value], [cntr_type]
INTO #PostWorkOSSnapShot
FROM sys.dm_os_performance_counters
SELECT
p2.object_name, p2.counter_name, p2.instance_name
, ISNULL(p1.cntr_value, 0) AS InitialValue
, p2.cntr_value AS FinalValue
, p2.cntr_value - ISNULL(p1.cntr_value, 0) AS Change
, (p2.cntr_value - ISNULL(p1.cntr_value, 0)) * 100 / p1.cntr_value
AS [% Change]
FROM #PreWorkOSSnapShot p1
RIGHT OUTER JOIN
#PostWorkOSSnapShot p2 ON p2.object_name =
ISNULL(p1.object_name, p2.object_name)
AND p2.counter_name = ISNULL(p1.counter_name, p2.counter_name)
AND p2.instance_name = ISNULL(p1.instance_name, p2.instance_name)
WHERE p2.cntr_value - ISNULL(p1.cntr_value, 0) > 0
AND ISNULL(p1.cntr_value, 0) != 0
ORDER BY [% Change] DESC, Change DESC
DROP TABLE #PreWorkOSSnapShot
DROP TABLE #PostWorkOSSnapShot
34. Changes in performance counters and wait states
SET TRANSACTION ISOLATION LEVEL READ UNCOMMITTED
SELECT
[object_name], [counter_name], [instance_name]
, [cntr_value], [cntr_type]
INTO #PreWorkOSSnapShot
FROM sys.dm_os_performance_counters
SELECT
wait_type, waiting_tasks_count
, wait_time_ms, max_wait_time_ms, signal_wait_time_ms
INTO #PreWorkWaitStats
FROM sys.dm_os_wait_stats
WAITFOR DELAY '00:05:00'
SELECT
wait_type, waiting_tasks_count, wait_time_ms
, max_wait_time_ms, signal_wait_time_ms
INTO #PostWorkWaitStats
FROM sys.dm_os_wait_stats
SELECT
[object_name], [counter_name], [instance_name]
, [cntr_value], [cntr_type]
INTO #PostWorkOSSnapShot
FROM sys.dm_os_performance_counters
SELECT
p2.wait_time_ms - ISNULL(p1.wait_time_ms, 0) AS wait_time_ms
, p2.signal_wait_time_ms - ISNULL(p1.signal_wait_time_ms, 0)
AS signal_wait_time_ms
, ((p2.wait_time_ms - ISNULL(p1.wait_time_ms, 0)) –
(p2.signal_wait_time_ms - ISNULL(p1.signal_wait_time_ms, 0)))
AS RealWait
, p2.wait_type
FROM #PreWorkWaitStats p1
RIGHT OUTER JOIN
#PostWorkWaitStats p2 ON p2.wait_type = ISNULL(p1.wait_type, p2.wait_type)
WHERE p2.wait_time_ms - ISNULL(p1.wait_time_ms, 0) > 0
AND p2.wait_type NOT LIKE '%SLEEP%'
AND p2.wait_type != 'WAITFOR'
ORDER BY RealWait DESC
SELECT
p2.object_name, p2.counter_name, p2.instance_name
, ISNULL(p1.cntr_value, 0) AS InitialValue
, p2.cntr_value AS FinalValue
, p2.cntr_value - ISNULL(p1.cntr_value, 0) AS Change
, (p2.cntr_value - ISNULL(p1.cntr_value, 0)) * 100 / p1.cntr_value
AS [% Change]
FROM #PreWorkOSSnapShot p1
RIGHT OUTER JOIN
#PostWorkOSSnapShot p2 ON p2.object_name =ISNULL(p1.object_name, p2.object_name)
AND p2.counter_name = ISNULL(p1.counter_name, p2.counter_name)
AND p2.instance_name = ISNULL(p1.instance_name, p2.instance_name)
WHERE p2.cntr_value - ISNULL(p1.cntr_value, 0) > 0
AND ISNULL(p1.cntr_value, 0) != 0
ORDER BY [% Change] DESC, Change DESC
DROP TABLE #PostWorkWaitStats
DROP TABLE #PreWorkWaitStats
DROP TABLE #PreWorkOSSnapShot
DROP TABLE #PostWorkOSSnapShot
35. Changes in performance counters and wait states
SET TRANSACTION ISOLATION LEVEL READ UNCOMMITTED

SELECT sql_handle
    ,plan_handle
    ,total_elapsed_time
    ,total_worker_time
    ,total_logical_reads
    ,total_logical_writes
    ,total_clr_time
    ,execution_count
    ,statement_start_offset
    ,statement_end_offset
INTO #PreWorkQuerySnapShot
FROM sys.dm_exec_query_stats

SELECT [object_name]
    ,[counter_name]
    ,[instance_name]
    ,[cntr_value]
    ,[cntr_type]
INTO #PreWorkOSSnapShot
FROM sys.dm_os_performance_counters

SELECT wait_type
    ,waiting_tasks_count
    ,wait_time_ms
    ,max_wait_time_ms
    ,signal_wait_time_ms
INTO #PreWorkWaitStats
FROM sys.dm_os_wait_stats

WAITFOR DELAY '00:05:00'

SELECT wait_type
    ,waiting_tasks_count
    ,wait_time_ms
    ,max_wait_time_ms
    ,signal_wait_time_ms
INTO #PostWorkWaitStats
FROM sys.dm_os_wait_stats

SELECT [object_name]
    ,[counter_name]
    ,[instance_name]
    ,[cntr_value]
    ,[cntr_type]
INTO #PostWorkOSSnapShot
FROM sys.dm_os_performance_counters

SELECT sql_handle
    ,plan_handle
    ,total_elapsed_time
    ,total_worker_time
    ,total_logical_reads
    ,total_logical_writes
    ,total_clr_time
    ,execution_count
    ,statement_start_offset
    ,statement_end_offset
INTO #PostWorkQuerySnapShot
FROM sys.dm_exec_query_stats

SELECT p2.total_elapsed_time - ISNULL(p1.total_elapsed_time, 0) AS [Duration]
    ,p2.total_worker_time - ISNULL(p1.total_worker_time, 0) AS [Time on CPU]
    ,(p2.total_elapsed_time - ISNULL(p1.total_elapsed_time, 0)) - (p2.total_worker_time - ISNULL(p1.total_worker_time, 0)) AS [Time blocked]
    ,p2.total_logical_reads - ISNULL(p1.total_logical_reads, 0) AS [Reads]
    ,p2.total_logical_writes - ISNULL(p1.total_logical_writes, 0) AS [Writes]
    ,p2.total_clr_time - ISNULL(p1.total_clr_time, 0) AS [CLR time]
    ,p2.execution_count - ISNULL(p1.execution_count, 0) AS [Executions]
    ,SUBSTRING(qt.TEXT, p2.statement_start_offset / 2 + 1, (
            (
                CASE
                    WHEN p2.statement_end_offset = - 1
                        THEN LEN(CONVERT(NVARCHAR(MAX), qt.TEXT)) * 2
                    ELSE p2.statement_end_offset
                    END - p2.statement_start_offset
                ) / 2
            ) + 1) AS [Individual Query]
    ,qt.TEXT AS [Parent Query]
    ,DB_NAME(qt.dbid) AS DatabaseName
FROM #PreWorkQuerySnapShot p1
RIGHT OUTER JOIN #PostWorkQuerySnapShot p2 ON p2.sql_handle = ISNULL(p1.sql_handle, p2.sql_handle)
    AND p2.plan_handle = ISNULL(p1.plan_handle, p2.plan_handle)
    AND p2.statement_start_offset = ISNULL(p1.statement_start_offset, p2.statement_start_offset)
    AND p2.statement_end_offset = ISNULL(p1.statement_end_offset, p2.statement_end_offset)
CROSS APPLY sys.dm_exec_sql_text(p2.sql_handle) AS qt
WHERE p2.execution_count != ISNULL(p1.execution_count, 0)
    AND qt.TEXT NOT LIKE '--ThisRoutineIdentifier%'
ORDER BY [Duration] DESC

SELECT p2.wait_time_ms - ISNULL(p1.wait_time_ms, 0) AS wait_time_ms
    ,p2.signal_wait_time_ms - ISNULL(p1.signal_wait_time_ms, 0) AS signal_wait_time_ms
    ,((p2.wait_time_ms - ISNULL(p1.wait_time_ms, 0))) AS wait_time_ms
    ,(p2.signal_wait_time_ms - ISNULL(p1.signal_wait_time_ms, 0)) AS RealWait
    ,p2.wait_type
FROM #PreWorkWaitStats p1
RIGHT OUTER JOIN #PostWorkWaitStats p2 ON p2.wait_type = ISNULL(p1.wait_type, p2.wait_type)
WHERE p2.wait_time_ms - ISNULL(p1.wait_time_ms, 0) > 0
    AND p2.wait_type NOT LIKE '%SLEEP%'
    AND p2.wait_type != 'WAITFOR'
ORDER BY RealWait DESC

SELECT p2.object_name
    ,p2.counter_name
    ,p2.instance_name
    ,ISNULL(p1.cntr_value, 0) AS InitialValue
    ,p2.cntr_value AS FinalValue
    ,p2.cntr_value - ISNULL(p1.cntr_value, 0) AS Change
    ,(p2.cntr_value - ISNULL(p1.cntr_value, 0)) * 100 / p1.cntr_value AS [% Change]
FROM #PreWorkOSSnapShot p1
RIGHT OUTER JOIN #PostWorkOSSnapShot p2 ON p2.object_name = ISNULL(p1.object_name, p2.object_name)
    AND p2.counter_name = ISNULL(p1.counter_name, p2.counter_name)
    AND p2.instance_name = ISNULL(p1.instance_name, p2.instance_name)
WHERE p2.cntr_value - ISNULL(p1.cntr_value, 0) > 0
    AND ISNULL(p1.cntr_value, 0) != 0
ORDER BY [% Change] DESC
    ,Change DESC

DROP TABLE #PreWorkQuerySnapShot
DROP TABLE #PostWorkQuerySnapShot
DROP TABLE #PostWorkWaitStats
DROP TABLE #PreWorkWaitStats
DROP TABLE #PreWorkOSSnapShot
DROP TABLE #PostWorkOSSnapShot
Resolving transaction issues
36. Observing the current locks
SELECT DB_NAME(resource_database_id) AS DatabaseName, request_session_id
, resource_type, request_status, request_mode
FROM sys.dm_tran_locks
WHERE request_session_id !=@@spid
ORDER BY request_session_id


37. Information contained in sessions, connections, and requests
SET TRANSACTION ISOLATION LEVEL READ UNCOMMITTED
SELECT *
FROM sys.dm_exec_sessions s
LEFT OUTER JOIN sys.dm_exec_connections c
ON s.session_id = c.session_id
LEFT OUTER JOIN sys.dm_exec_requests r
ON c.connection_id = r.connection_id
WHERE s.session_id > 50
38. How to discover which locks are currently held
SET TRANSACTION ISOLATION LEVEL READ UNCOMMITTED
SELECT DB_NAME(resource_database_id) AS DatabaseName
, request_session_id
, resource_type
, CASE
WHEN resource_type = 'OBJECT'
THEN OBJECT_NAME(resource_associated_entity_id)
WHEN resource_type IN ('KEY', 'PAGE', 'RID')
THEN (SELECT OBJECT_NAME(OBJECT_ID)
FROM sys.partitions p
WHERE p.hobt_id = l.resource_associated_entity_id)
END AS resource_type_name
, request_status
, request_mode
FROM sys.dm_tran_locks l
WHERE request_session_id !=@@spid
ORDER BY request_session_id
39. How to identify contended resources
SET TRANSACTION ISOLATION LEVEL READ UNCOMMITTED
SELECT
tl1.resource_type,
DB_NAME(tl1.resource_database_id) AS DatabaseName,
tl1.resource_associated_entity_id,
tl1.request_session_id,
tl1.request_mode,
tl1.request_status
, CASE
WHEN tl1.resource_type = 'OBJECT'
THEN OBJECT_NAME(tl1.resource_associated_entity_id)
WHEN tl1.resource_type IN ('KEY', 'PAGE', 'RID')
THEN (SELECT OBJECT_NAME(OBJECT_ID)
FROM sys.partitions s
WHERE s.hobt_id = tl1.resource_associated_entity_id)
END AS resource_type_name
FROM sys.dm_tran_locks as tl1
INNER JOIN sys.dm_tran_locks as tl2
ON tl1.resource_associated_entity_id = tl2.resource_associated_entity_id
AND tl1.request_status <> tl2.request_status
AND (tl1.resource_description = tl2.resource_description
OR (tl1.resource_description IS NULL
AND tl2.resource_description IS NULL))
ORDER BY tl1.resource_associated_entity_id, tl1.request_status
40. How to identify contended resources, including SQL query details
SET TRANSACTION ISOLATION LEVEL READ UNCOMMITTED
SELECT
tl1.resource_type
, DB_NAME(tl1.resource_database_id) AS DatabaseName
, tl1.resource_associated_entity_id
, tl1.request_session_id
, tl1.request_mode
, tl1.request_status
, CASE
WHEN tl1.resource_type = 'OBJECT'
THEN OBJECT_NAME(tl1.resource_associated_entity_id)
WHEN tl1.resource_type IN ('KEY', 'PAGE', 'RID')
THEN (SELECT OBJECT_NAME(OBJECT_ID)
FROM sys.partitions s
WHERE s.hobt_id = tl1.resource_associated_entity_id)
END AS resource_type_name
, t.text AS [Parent Query]
, SUBSTRING (t.text,(r.statement_start_offset/2) + 1,
((CASE WHEN r.statement_end_offset = -1
THEN LEN(CONVERT(NVARCHAR(MAX), t.text)) * 2
ELSE r.statement_end_offset
END - r.statement_start_offset)/2) + 1) AS [Individual Query]
FROM sys.dm_tran_locks as tl1
INNER JOIN sys.dm_tran_locks as tl2
ON tl1.resource_associated_entity_id = tl2.resource_associated_entity_id
AND tl1.request_status <> tl2.request_status
AND (tl1.resource_description = tl2.resource_description
OR (tl1.resource_description IS NULL
AND tl2.resource_description IS NULL))
INNER JOIN sys.dm_exec_connections c
ON tl1.request_session_id = c.most_recent_session_id
CROSS APPLY sys.dm_exec_sql_text(c.most_recent_sql_handle) t
LEFT OUTER JOIN sys.dm_exec_requests r ON c.connection_id = r.connection_id
ORDER BY tl1.resource_associated_entity_id, tl1.request_status
41. How to find an idle session with an open transaction
SET TRANSACTION ISOLATION LEVEL READ UNCOMMITTED
SELECT es.session_id, es.login_name, es.host_name, est.text
, cn.last_read, cn.last_write, es.program_name
FROM sys.dm_exec_sessions es
INNER JOIN sys.dm_tran_session_transactions st
ON es.session_id = st.session_id
INNER JOIN sys.dm_exec_connections cn
ON es.session_id = cn.session_id
CROSS APPLY sys.dm_exec_sql_text(cn.most_recent_sql_handle) est
LEFT OUTER JOIN sys.dm_exec_requests er
ON st.session_id = er.session_id
AND er.session_id IS NULL
42. Amount of space (total, used, and free) in tempdb
SET TRANSACTION ISOLATION LEVEL READ UNCOMMITTED
SELECT SUM(user_object_reserved_page_count
+ internal_object_reserved_page_count
+ version_store_reserved_page_count
+ mixed_extent_page_count
+ unallocated_extent_page_count) * (8.0/1024.0)
AS [TotalSizeOfTempDB(MB)]
, SUM(user_object_reserved_page_count
+ internal_object_reserved_page_count
+ version_store_reserved_page_count
+ mixed_extent_page_count) * (8.0/1024.0)
AS [UsedSpace (MB)]
, SUM(unallocated_extent_page_count * (8.0/1024.0))
AS [FreeSpace (MB)]
FROM sys.dm_db_file_space_usage
43. Total amount of space (data, log, and log used) by database
SET TRANSACTION ISOLATION LEVEL READ UNCOMMITTED
SELECT instance_name
, counter_name
, cntr_value / 1024.0 AS [Size(MB)]
FROM sys.dm_os_performance_counters
WHERE object_name = 'SQLServer:Databases'
AND counter_name IN (
'Data File(s) Size (KB)'
, 'Log File(s) Size (KB)'
, 'Log File(s) Used Size (KB)')
ORDER BY instance_name, counter_name
44. Tempdb total space usage by object type
SET TRANSACTION ISOLATION LEVEL READ UNCOMMITTED
SELECT
SUM (user_object_reserved_page_count) * (8.0/1024.0)
AS [User Objects (MB)],
SUM (internal_object_reserved_page_count) * (8.0/1024.0)
AS [Internal Objects (MB)],
SUM (version_store_reserved_page_count) * (8.0/1024.0)
AS [Version Store (MB)],
SUM (mixed_extent_page_count)* (8.0/1024.0)
AS [Mixed Extent (MB)],
SUM (unallocated_extent_page_count)* (8.0/1024.0)
AS [Unallocated (MB)]
FROM sys.dm_db_file_space_usage
45. tempdb Space usage by session
SET TRANSACTION ISOLATION LEVEL READ UNCOMMITTED
SELECT es.session_id
, ec.connection_id
, es.login_name
, es.host_name
, st.text
, su.user_objects_alloc_page_count
, su.user_objects_dealloc_page_count
, su.internal_objects_alloc_page_count
, su.internal_objects_dealloc_page_count
, ec.last_read
, ec.last_write
, es.program_name
FROM sys.dm_db_session_space_usage su
INNER JOIN sys.dm_exec_sessions es
ON su.session_id = es.session_id
LEFT OUTER JOIN sys.dm_exec_connections ec
ON su.session_id = ec.most_recent_session_id
OUTER APPLY sys.dm_exec_sql_text(ec.most_recent_sql_handle) st
WHERE su.session_id > 50
46. Space used and reclaimed in tempdb for completed batches
SET TRANSACTION ISOLATION LEVEL READ UNCOMMITTED
SELECT CAST(SUM(su.user_objects_alloc_page_count
+ su.internal_objects_alloc_page_count) * (8.0/1024.0)
AS DECIMAL(20,3)) AS [SpaceUsed(MB)]
, CAST(SUM(su.user_objects_alloc_page_count
– su.user_objects_dealloc_page_count
+ su.internal_objects_alloc_page_count
– su.internal_objects_dealloc_page_count)
* (8.0/1024.0) AS DECIMAL(20,3)) AS [SpaceStillUsed(MB)]
, su.session_id
, ec.connection_id
, es.host_name
, st.text AS [LastQuery]
, ec.last_read
, ec.last_write
, es.program_name
FROM sys.dm_db_session_space_usage su
INNER JOIN sys.dm_exec_sessions es ON su.session_id = es.session_id
LEFT OUTER JOIN sys.dm_exec_connections ec
ON su.session_id = ec.most_recent_session_id
OUTER APPLY sys.dm_exec_sql_text(ec.most_recent_sql_handle) st
WHERE su.session_id > 50
GROUP BY su.session_id, ec.connection_id, es.login_name, es.host_name
, st.text, ec.last_read, ec.last_write, es.program_name
ORDER BY [SpaceStillUsed(MB)] DESC
47. Space used by running SQL queries
SET TRANSACTION ISOLATION LEVEL READ UNCOMMITTED
SELECT es.session_id
, ec.connection_id
, es.login_name
, es.host_name
, st.text
, tu.user_objects_alloc_page_count
, tu.user_objects_dealloc_page_count
, tu.internal_objects_alloc_page_count
, tu.internal_objects_dealloc_page_count
, ec.last_read
, ec.last_write
, es.program_name
FROM sys.dm_db_task_space_usage tu
INNER JOIN sys.dm_exec_sessions es ON tu.session_id = es.session_id
LEFT OUTER JOIN sys.dm_exec_connections ec
ON tu.session_id = ec.most_recent_session_id
OUTER APPLY sys.dm_exec_sql_text(ec.most_recent_sql_handle) st
WHERE tu.session_id > 50
48. Space used and not reclaimed by active SQL queries
SET TRANSACTION ISOLATION LEVEL READ UNCOMMITTED
SELECT SUM(ts.user_objects_alloc_page_count
+ ts.internal_objects_alloc_page_count)
* (8.0/1024.0) AS [SpaceUsed(MB)]
, SUM(ts.user_objects_alloc_page_count
– ts.user_objects_dealloc_page_count
+ ts.internal_objects_alloc_page_count
– ts.internal_objects_dealloc_page_count)
* (8.0/1024.0) AS [SpaceStillUsed(MB)]
, ts.session_id
, ec.connection_id
, es.login_name
, es.host_name
, st.text AS [Parent Query]
, SUBSTRING (st.text,(er.statement_start_offset/2) + 1,
((CASE WHEN er.statement_end_offset = -1
THEN LEN(CONVERT(NVARCHAR(MAX), st.text)) * 2
ELSE er.statement_end_offset
END - er.statement_start_offset)/2) + 1) AS [Current Query]
, ec.last_read
, ec.last_write
, es.program_name
FROM sys.dm_db_task_space_usage ts
INNER JOIN sys.dm_exec_sessions es ON ts.session_id = es.session_id
LEFT OUTER JOIN sys.dm_exec_connections ec
ON ts.session_id = ec.most_recent_session_id
OUTER APPLY sys.dm_exec_sql_text(ec.most_recent_sql_handle) st
LEFT OUTER JOIN sys.dm_exec_requests er ON ts.session_id = er.session_id
WHERE ts.session_id > 50
GROUP BY ts.session_id, ec.connection_id, es.login_name, es.host_name
, st.text, ec.last_read, ec.last_write, es.program_name
, SUBSTRING (st.text,(er.statement_start_offset/2) + 1,
((CASE WHEN er.statement_end_offset = -1
THEN LEN(CONVERT(NVARCHAR(MAX), st.text)) * 2
ELSE er.statement_end_offset
END - er.statement_start_offset)/2) + 1)
ORDER BY [SpaceStillUsed(MB)] DESC
49. Indexes under row-locking pressure
SET TRANSACTION ISOLATION LEVEL READ UNCOMMITTED
SELECT TOP 20
x.name AS SchemaName
, OBJECT_NAME(s.object_id) AS TableName
, i.name AS IndexName
, s.row_lock_wait_in_ms
, s.row_lock_wait_count
FROM sys.dm_db_index_operational_stats(db_ID(), NULL, NULL, NULL) s
INNER JOIN sys.objects o ON s.object_id = o.object_id
INNER JOIN sys.indexes i ON s.index_id = i.index_id
AND i.object_id = o.object_id
INNER JOIN sys.schemas x ON x.schema_id = o.schema_id
WHERE s.row_lock_wait_in_ms > 0
AND o.is_ms_shipped = 0
ORDER BY s.row_lock_wait_in_ms DESC
50. Indexes with the most lock escalations
SET TRANSACTION ISOLATION LEVEL READ UNCOMMITTED
SELECT TOP 20
x.name AS SchemaName
, OBJECT_NAME (s.object_id) AS TableName
, i.name AS IndexName
, s.index_lock_promotion_count
FROM sys.dm_db_index_operational_stats(db_ID(), NULL, NULL, NULL) s
INNER JOIN sys.objects o ON s.object_id = o.object_id
INNER JOIN sys.indexes i ON s.index_id = i.index_id
AND i.object_id = o.object_id
INNER JOIN sys.schemas x ON x.schema_id = o.schema_id
WHERE s.index_lock_promotion_count > 0
AND o.is_ms_shipped = 0
ORDER BY s.index_lock_promotion_count DESC
51. Indexes with the most unsuccessful lock escalations
SET TRANSACTION ISOLATION LEVEL READ UNCOMMITTED
SELECT TOP 20
x.name AS SchemaName
, OBJECT_NAME (s.object_id) AS TableName
, i.name AS IndexName
, s.index_lock_promotion_attempt_count – s.index_lock_promotion_count
AS UnsuccessfulIndexLockPromotions
FROM sys.dm_db_index_operational_stats(db_ID(), NULL, NULL, NULL) s
INNER JOIN sys.objects o ON s.object_id = o.object_id
INNER JOIN sys.indexes i ON s.index_id = i.index_id
AND i.object_id = o.object_id
INNER JOIN sys.schemas x ON x.schema_id = o.schema_id
WHERE (s.index_lock_promotion_attempt_count - index_lock_promotion_count)>0
AND o.is_ms_shipped = 0
ORDER BY UnsuccessfulIndexLockPromotions DESC
52. Indexes with the most page splits
SET TRANSACTION ISOLATION LEVEL READ UNCOMMITTED
SELECT TOP 20
x.name AS SchemaName
, object_name(s.object_id) AS TableName
, i.name AS IndexName
, s.leaf_allocation_count
, s.nonleaf_allocation_count
FROM sys.dm_db_index_operational_stats(DB_ID(), NULL, NULL, NULL) s
INNER JOIN sys.objects o ON s.object_id = o.object_id
INNER JOIN sys.indexes i ON s.index_id = i.index_id
AND i.object_id = o.object_id
INNER JOIN sys.schemas x ON x.schema_id = o.schema_id
WHERE s.leaf_allocation_count > 0
AND o.is_ms_shipped = 0
ORDER BY s.leaf_allocation_count DESC
53. Indexes with the most latch contention
SET TRANSACTION ISOLATION LEVEL READ UNCOMMITTED
SELECT TOP 20
x.name AS SchemaName
, OBJECT_NAME(s.object_id) AS TableName
, i.name AS IndexName
, s.page_latch_wait_in_ms
, s.page_latch_wait_count
FROM sys.dm_db_index_operational_stats(db_ID(), NULL, NULL, NULL) s
INNER JOIN sys.objects o ON s.object_id = o.object_id
INNER JOIN sys.indexes i ON s.index_id = i.index_id
AND i.object_id = o.object_id
INNER JOIN sys.schemas x ON x.schema_id = o.schema_id
WHERE s.page_latch_wait_in_ms > 0
AND o.is_ms_shipped = 0
ORDER BY s.page_latch_wait_in_ms DESC
54. Indexes with the most page I/O-latch contention
SET TRANSACTION ISOLATION LEVEL READ UNCOMMITTED

SELECT x.NAME AS SchemaName
    ,OBJECT_NAME(s.object_id) AS TableName
    ,i.NAME AS IndexName
    ,s.row_lock_wait_in_ms
INTO #PreWorkIndexCount
FROM sys.dm_db_index_operational_stats(DB_ID(), NULL, NULL, NULL) s
INNER JOIN sys.objects o ON s.object_id = o.object_id
INNER JOIN sys.indexes i ON s.index_id = i.index_id
    AND i.object_id = o.object_id
INNER JOIN sys.schemas x ON x.schema_id = o.schema_id
WHERE s.row_lock_wait_in_ms > 0
    AND o.is_ms_shipped = 0

SELECT sql_handle
    ,plan_handle
    ,total_elapsed_time
    ,total_worker_time
    ,total_logical_reads
    ,total_logical_writes
    ,total_clr_time
    ,execution_count
    ,statement_start_offset
    ,statement_end_offset
INTO #PreWorkQuerySnapShot
FROM sys.dm_exec_query_stats

WAITFOR DELAY '01:00:00'

SELECT x.NAME AS SchemaName
    ,OBJECT_NAME(s.object_id) AS TableName
    ,i.NAME AS IndexName
    ,s.row_lock_wait_in_ms
INTO #PostWorkIndexCount
FROM sys.dm_db_index_operational_stats(DB_ID(), NULL, NULL, NULL) s
INNER JOIN sys.objects o ON s.object_id = o.object_id
INNER JOIN sys.indexes i ON s.index_id = i.index_id
    AND i.object_id = o.object_id
INNER JOIN sys.schemas x ON x.schema_id = o.schema_id
WHERE s.row_lock_wait_in_ms > 0
    AND o.is_ms_shipped = 0

SELECT sql_handle
    ,plan_handle
    ,total_elapsed_time
    ,total_worker_time
    ,total_logical_reads
    ,total_logical_writes
    ,total_clr_time
    ,execution_count
    ,statement_start_offset
    ,statement_end_offset
INTO #PostWorkQuerySnapShot
FROM sys.dm_exec_query_stats

SELECT p2.SchemaName
    ,p2.TableName
    ,p2.IndexName
    ,p2.row_lock_wait_in_ms - ISNULL(p1.row_lock_wait_in_ms, 0) AS RowLockWaitTimeDelta_ms
FROM #PreWorkIndexCount p1
RIGHT OUTER JOIN #PostWorkIndexCount p2 ON p2.SchemaName = ISNULL(p1.SchemaName, p2.SchemaName)
    AND p2.TableName = ISNULL(p1.TableName, p2.TableName)
    AND p2.IndexName = ISNULL(p1.IndexName, p2.IndexName)
WHERE p2.row_lock_wait_in_ms - ISNULL(p1.row_lock_wait_in_ms, 0) > 0
ORDER BY RowLockWaitTimeDelta_ms DESC

SELECT p2.total_elapsed_time - ISNULL(p1.total_elapsed_time, 0) AS [Duration]
    ,p2.total_worker_time - ISNULL(p1.total_worker_time, 0) AS [Time on CPU]
    ,(p2.total_elapsed_time - ISNULL(p1.total_elapsed_time, 0))
    ,(p2.total_worker_time - ISNULL(p1.total_worker_time, 0)) AS [Time blocked]
    ,p2.total_logical_reads - ISNULL(p1.total_logical_reads, 0) AS [Reads]
    ,p2.total_logical_writes - ISNULL(p1.total_logical_writes, 0) AS [Writes]
    ,p2.total_clr_time - ISNULL(p1.total_clr_time, 0) AS [CLR time]
    ,p2.execution_count - ISNULL(p1.execution_count, 0) AS [Executions]
    ,SUBSTRING(qt.TEXT, p2.statement_start_offset / 2 + 1, (
            (
                CASE
                    WHEN p2.statement_end_offset = - 1
                        THEN LEN(CONVERT(NVARCHAR(MAX), qt.TEXT)) * 2
                    ELSE p2.statement_end_offset
                    END - p2.statement_start_offset
                ) / 2
            ) + 1) AS [Individual Query]
    ,qt.TEXT AS [Parent Query]
    ,DB_NAME(qt.dbid) AS DatabaseName
FROM #PreWorkQuerySnapShot p1
RIGHT OUTER JOIN #PostWorkQuerySnapShot p2 ON p2.sql_handle = ISNULL(p1.sql_handle, p2.sql_handle)
    AND p2.plan_handle = ISNULL(p1.plan_handle, p2.plan_handle)
    AND p2.statement_start_offset = ISNULL(p1.statement_start_offset, p2.statement_start_offset)
    AND p2.statement_end_offset = ISNULL(p1.statement_end_offset, p2.statement_end_offset)
CROSS APPLY sys.dm_exec_sql_text(p2.sql_handle) AS qt
WHERE p2.execution_count != ISNULL(p1.execution_count, 0)
    AND qt.TEXT NOT LIKE '--ThisRoutineIdentifier%'
ORDER BY [Duration] DESC

DROP TABLE #PreWorkIndexCount
DROP TABLE #PostWorkIndexCount
DROP TABLE #PreWorkQuerySnapShot
DROP TABLE #PostWorkQuerySnapShot
55. Determining how many rows are inserted/deleted/updated/selected
SET TRANSACTION ISOLATION LEVEL READ UNCOMMITTED
SELECT
sql_handle, plan_handle, total_elapsed_time, total_worker_time
, total_logical_reads, total_logical_writes, total_clr_time
, execution_count, statement_start_offset, statement_end_offset
INTO #PreWorkQuerySnapShot
FROM sys.dm_exec_query_stats
SELECT x.name AS SchemaName
, OBJECT_NAME (s.object_id) AS TableName
, i.name AS IndexName
, s.leaf_delete_count
, s.leaf_ghost_count
, s.leaf_insert_count
, s.leaf_update_count
, s.range_scan_count
, s.singleton_lookup_count
INTO #PreWorkIndexCount
FROM sys.dm_db_index_operational_stats(DB_ID(), NULL, NULL, NULL) s
INNER JOIN sys.objects o ON s.object_id = o.object_id
INNER JOIN sys.indexes i ON s.index_id = i.index_id
AND i.object_id = o.object_id
INNER JOIN sys.schemas x ON x.schema_id = o.schema_id
WHERE o.is_ms_shipped = 0
WAITFOR DELAY '01:00:00'
SELECT
sql_handle, plan_handle, total_elapsed_time, total_worker_time
, total_logical_reads, total_logical_writes, total_clr_time
, execution_count, statement_start_offset, statement_end_offset
INTO #PostWorkQuerySnapShot
FROM sys.dm_exec_query_stats
SELECT x.name AS SchemaName
, OBJECT_NAME (s.object_id) AS TableName
, i.name AS IndexName
, s.leaf_delete_count
, s.leaf_ghost_count
, s.leaf_insert_count
, s.leaf_update_count
, s.range_scan_count
, s.singleton_lookup_count
INTO #PostWorkIndexCount
FROM sys.dm_db_index_operational_stats(DB_ID(), NULL, NULL, NULL) s
INNER JOIN sys.objects o ON s.object_id = o.object_id
INNER JOIN sys.indexes i ON s.index_id = i.index_id
AND i.object_id = o.object_id
INNER JOIN sys.schemas x ON x.schema_id = o.schema_id
WHERE o.is_ms_shipped = 0
SELECT
p2.SchemaName
, p2.TableName
, p2.IndexName
, p2.leaf_delete_count - ISNULL(p1.leaf_delete_count, 0)
AS leaf_delete_countDelta
, p2.leaf_ghost_count - ISNULL(p1.leaf_ghost_count, 0)
AS leaf_ghost_countDelta
, p2.leaf_insert_count - ISNULL(p1.leaf_insert_count, 0)
AS leaf_insert_countDelta
, p2.leaf_update_count - ISNULL(p1.leaf_update_count, 0)
AS leaf_update_countDelta
, p2.range_scan_count - ISNULL(p1.range_scan_count, 0)
AS range_scan_countDelta
, p2.singleton_lookup_count - ISNULL(p1.singleton_lookup_count, 0)
AS singleton_lookup_countDelta
FROM #PreWorkIndexCount p1
RIGHT OUTER JOIN
#PostWorkIndexCount p2 ON p2.SchemaName =
ISNULL(p1.SchemaName, p2.SchemaName)
AND p2.TableName = ISNULL(p1.TableName, p2.TableName)
AND p2.IndexName = ISNULL(p1.IndexName, p2.IndexName)
WHERE p2.leaf_delete_count - ISNULL(p1.leaf_delete_count, 0) > 0
OR p2.leaf_ghost_count - ISNULL(p1.leaf_ghost_count, 0) > 0
OR p2.leaf_insert_count - ISNULL(p1.leaf_insert_count, 0) > 0
OR p2.leaf_update_count - ISNULL(p1.leaf_update_count, 0) > 0
OR p2.range_scan_count - ISNULL(p1.range_scan_count, 0) > 0
OR p2.singleton_lookup_count - ISNULL(p1.singleton_lookup_count, 0) > 0
ORDER BY leaf_delete_countDelta DESC
SELECT
p2.total_elapsed_time - ISNULL(p1.total_elapsed_time, 0) AS [Duration]
, p2.total_worker_time - ISNULL(p1.total_worker_time, 0) AS [Time on CPU]
, (p2.total_elapsed_time - ISNULL(p1.total_elapsed_time, 0)) –
(p2.total_worker_time - ISNULL(p1.total_worker_time, 0))
AS [Time blocked]
, p2.total_logical_reads - ISNULL(p1.total_logical_reads, 0) AS [Reads]
, p2.total_logical_writes - ISNULL(p1.total_logical_writes, 0)
AS [Writes]
, p2.total_clr_time - ISNULL(p1.total_clr_time, 0) AS [CLR time]
, p2.execution_count - ISNULL(p1.execution_count, 0) AS [Executions]
, SUBSTRING (qt.text,p2.statement_start_offset/2 + 1,
((CASE WHEN p2.statement_end_offset = -1
THEN LEN(CONVERT(NVARCHAR(MAX), qt.text)) * 2
ELSE p2.statement_end_offset
END - p2.statement_start_offset)/2) + 1) AS [Individual Query]
, qt.text AS [Parent Query]
, DB_NAME(qt.dbid) AS DatabaseName
FROM #PreWorkQuerySnapShot p1
RIGHT OUTER JOIN
#PostWorkQuerySnapShot p2 ON p2.sql_handle =
ISNULL(p1.sql_handle, p2.sql_handle)
AND p2.plan_handle = ISNULL(p1.plan_handle, p2.plan_handle)
AND p2.statement_start_offset =
ISNULL(p1.statement_start_offset, p2.statement_start_offset)
AND p2.statement_end_offset =
ISNULL(p1.statement_end_offset, p2.statement_end_offset)
CROSS APPLY sys.dm_exec_sql_text(p2.sql_handle) as qt
WHERE p2.execution_count != ISNULL(p1.execution_count, 0)
ORDER BY [Duration] DESC
DROP TABLE #PreWorkIndexCount
DROP TABLE #PostWorkIndexCount
DROP TABLE #PreWorkQuerySnapShot
DROP TABLE #PostWorkQuerySnapShot
56. Rebuilding and reorganizing fragmented indexes
SET TRANSACTION ISOLATION LEVEL READ UNCOMMITTED
CREATE TABLE #FragmentedIndexes(
DatabaseName SYSNAME
, SchemaName SYSNAME
, TableName SYSNAME
, IndexName SYSNAME
, [Fragmentation%] FLOAT)
INSERT INTO #FragmentedIndexes
SELECT
DB_NAME(DB_ID()) AS DatabaseName
, ss.name AS SchemaName
, OBJECT_NAME (s.object_id) AS TableName
, i.name AS IndexName
, s.avg_fragmentation_in_percent AS [Fragmentation%]
FROM sys.dm_db_index_physical_stats(db_id(),NULL, NULL, NULL, 'SAMPLED') s
INNER JOIN sys.indexes i ON s.[object_id] = i.[object_id]
AND s.index_id = i.index_id
INNER JOIN sys.objects o ON s.object_id = o.object_id
INNER JOIN sys.schemas ss ON ss.[schema_id] = o.[schema_id]
WHERE s.database_id = DB_ID()
AND i.index_id != 0
AND s.record_count > 0
AND o.is_ms_shipped = 0
DECLARE @RebuildIndexesSQL NVARCHAR(MAX)
SET @RebuildIndexesSQL = ''
SELECT
@RebuildIndexesSQL = @RebuildIndexesSQL +
CASE
WHEN [Fragmentation%] > 30
THEN CHAR(10) + 'ALTER INDEX ' + QUOTENAME(IndexName) + ' ON '
+ QUOTENAME(SchemaName) + '.'
+ QUOTENAME(TableName) + ' REBUILD;'
WHEN [Fragmentation%] > 10
THEN CHAR(10) + 'ALTER INDEX ' + QUOTENAME(IndexName) + ' ON '
+ QUOTENAME(SchemaName) + '.'
+ QUOTENAME(TableName) + ' REORGANIZE;'
END
FROM #FragmentedIndexes
WHERE [Fragmentation%] > 10
DECLARE @StartOffset INT
DECLARE @Length INT
SET @StartOffset = 0
SET @Length = 4000
WHILE (@StartOffset < LEN(@RebuildIndexesSQL))
BEGIN
PRINT SUBSTRING(@RebuildIndexesSQL, @StartOffset, @Length)
SET @StartOffset = @StartOffset + @Length
END
PRINT SUBSTRING(@RebuildIndexesSQL, @StartOffset, @Length)
EXECUTE sp_executesql @RebuildIndexesSQL
DROP TABLE #FragmentedIndexes
57. Rebuild/reorganize for all databases on a given server
SET TRANSACTION ISOLATION LEVEL READ UNCOMMITTED
CREATE TABLE #FragmentedIndexes(
DatabaseName SYSNAME
, SchemaName SYSNAME
, TableName SYSNAME
, IndexName SYSNAME
, [Fragmentation%] FLOAT)
EXEC sp_MSForEachDB 'USE [?]; INSERT INTO #FragmentedIndexes SELECT DB_NAME(DB_ID()) AS DatabaseName , ss.name AS SchemaName , OBJECT_NAME (s.object_id) AS TableName , i.name AS IndexName , s.avg_fragmentation_in_percent AS [Fragmentation%] FROM sys.dm_db_index_physical_stats(db_id(),NULL, NULL, NULL, ''SAMPLED'') s INNER JOIN sys.indexes i ON s.[object_id] = i.[object_id] AND s.index_id = i.index_id INNER JOIN sys.objects o ON s.object_id = o.object_id INNER JOIN sys.schemas ss ON ss.[schema_id] = o.[schema_id] WHERE s.database_id = DB_ID() AND i.index_id != 0 AND s.record_count > 0 AND o.is_ms_shipped = 0 ;'
DECLARE @RebuildIndexesSQL NVARCHAR(MAX)
SET @RebuildIndexesSQL = ''
SELECT
@RebuildIndexesSQL = @RebuildIndexesSQL +
CASE
WHEN [Fragmentation%] > 30
THEN CHAR(10) + 'ALTER INDEX ' + QUOTENAME(IndexName) + ' ON '
+ QUOTENAME(DatabaseName) + '.'+ QUOTENAME(SchemaName) + '.'
+ QUOTENAME(TableName) + ' REBUILD;'
WHEN [Fragmentation%] > 10
THEN CHAR(10) + 'ALTER INDEX ' + QUOTENAME(IndexName) + ' ON '
+ QUOTENAME(DatabaseName) + '.'+ QUOTENAME(SchemaName) + '.'
+ QUOTENAME(TableName) + ' REORGANIZE;'
END
FROM #FragmentedIndexes
WHERE [Fragmentation%] > 10
DECLARE @StartOffset INT
DECLARE @Length INT
SET @StartOffset = 0
SET @Length = 4000
WHILE (@StartOffset < LEN(@RebuildIndexesSQL))
BEGIN
PRINT SUBSTRING(@RebuildIndexesSQL, @StartOffset, @Length)
SET @StartOffset = @StartOffset + @Length
END
PRINT SUBSTRING(@RebuildIndexesSQL, @StartOffset, @Length)
EXECUTE sp_executesql @RebuildIndexesSQL
DROP TABLE #FragmentedIndexes
58. Intelligently update statistics—simple version
SET TRANSACTION ISOLATION LEVEL READ UNCOMMITTED
SELECT
ss.name AS SchemaName
, st.name AS TableName
, si.name AS IndexName
, si.type_desc AS IndexType
, STATS_DATE(si.object_id,si.index_id) AS StatsLastTaken
, ssi.rowcnt
, ssi.rowmodctr
INTO #IndexUsage
FROM sys.indexes si
INNER JOIN sys.sysindexes ssi ON si.object_id = ssi.id
AND si.name = ssi.name
INNER JOIN sys.tables st ON st.[object_id] = si.[object_id]
INNER JOIN sys.schemas ss ON ss.[schema_id] = st.[schema_id]
WHERE st.is_ms_shipped = 0
AND si.index_id != 0
AND ssi.rowcnt > 100
AND ssi.rowmodctr > 0
DECLARE @UpdateStatisticsSQL NVARCHAR(MAX)
SET @UpdateStatisticsSQL = ''
SELECT
@UpdateStatisticsSQL = @UpdateStatisticsSQL
+ CHAR(10) + 'UPDATE STATISTICS '
+ QUOTENAME(SchemaName) + '.' + QUOTENAME(TableName)
+ ' ' + QUOTENAME(IndexName) + ' WITH SAMPLE '
+ CASE
WHEN rowcnt < 500000 THEN '100 PERCENT'
WHEN rowcnt < 1000000 THEN '50 PERCENT'
WHEN rowcnt < 5000000 THEN '25 PERCENT'
WHEN rowcnt < 10000000 THEN '10 PERCENT'
WHEN rowcnt < 50000000 THEN '2 PERCENT'
WHEN rowcnt < 100000000 THEN '1 PERCENT'
ELSE '3000000 ROWS '
END
+ '-- ' + CAST(rowcnt AS VARCHAR(22)) + ' rows'
FROM #IndexUsage
DECLARE @StartOffset INT
DECLARE @Length INT
SET @StartOffset = 0
SET @Length = 4000
WHILE (@StartOffset < LEN(@UpdateStatisticsSQL))
BEGIN
PRINT SUBSTRING(@UpdateStatisticsSQL, @StartOffset, @Length)
SET @StartOffset = @StartOffset + @Length
END
PRINT SUBSTRING(@UpdateStatisticsSQL, @StartOffset, @Length)
EXECUTE sp_executesql @UpdateStatisticsSQL
DROP TABLE #IndexUsage
59. Estimating when a job will finish
SET TRANSACTION ISOLATION LEVEL READ UNCOMMITTED
SELECT r.percent_complete
, DATEDIFF(MINUTE, start_time, GETDATE()) AS Age
, DATEADD(MINUTE, DATEDIFF(MINUTE, start_time, GETDATE()) /
percent_complete * 100, start_time) AS EstimatedEndTime
, t.Text AS ParentQuery
, SUBSTRING (t.text,(r.statement_start_offset/2) + 1,
((CASE WHEN r.statement_end_offset = -1
THEN LEN(CONVERT(NVARCHAR(MAX), t.text)) * 2
ELSE r.statement_end_offset
END - r.statement_start_offset)/2) + 1) AS IndividualQuery
, start_time
, DB_NAME(Database_Id) AS DatabaseName
, Status
FROM sys.dm_exec_requests r
CROSS APPLY sys.dm_exec_sql_text(sql_handle) t
WHERE session_id > 50
AND percent_complete > 0
ORDER BY percent_complete DESC
60. Who’s doing what and when?
SET TRANSACTION ISOLATION LEVEL READ UNCOMMITTED
CREATE TABLE dbo.WhatsGoingOnHistory(
[Runtime] [DateTime],
[session_id] [smallint] NOT NULL,
[login_name] [varchar](128) NOT NULL,
[host_name] [varchar](128) NULL,
[DBName] [varchar](128) NULL,
[Individual Query] [varchar](max) NULL,
[Parent Query] [varchar](200) NULL,
[status] [varchar](30) NULL,
[start_time] [datetime] NULL,
[wait_type] [varchar](60) NULL,
[program_name] [varchar](128) NULL
)
GO
CREATE UNIQUE NONCLUSTERED INDEX
[NONCLST_WhatsGoingOnHistory] ON [dbo].[WhatsGoingOnHistory]
([Runtime] ASC, [session_id] ASC)
GO
INSERT INTO dbo.WhatsGoingOnHistory
SELECT
GETDATE()
, s.session_id
, s.login_name
, s.host_name
, DB_NAME(r.database_id) AS DBName
, SUBSTRING (t.text,(r.statement_start_offset/2) + 1,
((CASE WHEN r.statement_end_offset = -1
THEN LEN(CONVERT(NVARCHAR(MAX), t.text)) * 2
ELSE r.statement_end_offset
END - r.statement_start_offset)/2) + 1) AS [Individual Query]
, SUBSTRING(text, 1, 200) AS [Parent Query]
, r.status
, r.start_time
, r.wait_type
, s.program_name
FROM sys.dm_exec_sessions s
INNER JOIN sys.dm_exec_connections c ON s.session_id = c.session_id
INNER JOIN sys.dm_exec_requests r ON c.connection_id = r.connection_id
CROSS APPLY sys.dm_exec_sql_text(r.sql_handle) t
WHERE s.session_id > 50
AND r.session_id != @@spid
WAITFOR DELAY '00:01:00'
GO 1440 -- 60 * 24 (one day)
61. Determining where your query spends its time
SET TRANSACTION ISOLATION LEVEL READ UNCOMMITTED
SELECT
sql_handle, plan_handle, total_elapsed_time, total_worker_time
, total_logical_reads, total_logical_writes, total_clr_time
, execution_count, statement_start_offset, statement_end_offset
INTO #PreWorkQuerySnapShot
FROM sys.dm_exec_query_stats
EXEC MO.PNLYearToDate_v01iws
@pControlOrgIds = '537'
, @pCOBStart = '27 may 2009'
, @pCOBEnd = '27 may 2009'
SELECT
sql_handle, plan_handle, total_elapsed_time, total_worker_time
, total_logical_reads, total_logical_writes, total_clr_time
, execution_count, statement_start_offset, statement_end_offset,
last_execution_time
INTO #PostWorkQuerySnapShot
FROM sys.dm_exec_query_stats
SELECT
p2.total_elapsed_time - ISNULL(p1.total_elapsed_time, 0) AS [Duration]
, p2.total_worker_time - ISNULL(p1.total_worker_time, 0) AS [Time on CPU]
, (p2.total_elapsed_time - ISNULL(p1.total_elapsed_time, 0)) -
(p2.total_worker_time - ISNULL(p1.total_worker_time, 0))
AS [Time waiting]
, p2.total_logical_reads - ISNULL(p1.total_logical_reads, 0) AS [Reads]
, p2.total_logical_writes - ISNULL(p1.total_logical_writes, 0)
AS [Writes]
, p2.total_clr_time - ISNULL(p1.total_clr_time, 0) AS [CLR time]
, p2.execution_count - ISNULL(p1.execution_count, 0) AS [Executions]
, p2.last_execution_time
, SUBSTRING (qt.text,p2.statement_start_offset/2 + 1,
((CASE WHEN p2.statement_end_offset = -1
THEN LEN(CONVERT(NVARCHAR(MAX), qt.text)) * 2
ELSE p2.statement_end_offset
END - p2.statement_start_offset)/2) + 1) AS [Individual Query]
, qt.text AS [Parent Query]
, DB_NAME(qt.dbid) AS DatabaseName
FROM #PreWorkQuerySnapShot p1
RIGHT OUTER JOIN
#PostWorkQuerySnapShot p2
ON p2.sql_handle = ISNULL(p1.sql_handle, p2.sql_handle)
AND p2.plan_handle = ISNULL(p1.plan_handle, p2.plan_handle)
AND p2.statement_start_offset =
ISNULL(p1.statement_start_offset, p2.statement_start_offset)
AND p2.statement_end_offset =
ISNULL(p1.statement_end_offset, p2.statement_end_offset)
CROSS APPLY sys.dm_exec_sql_text(p2.sql_handle) as qt
WHERE p2.execution_count != ISNULL(p1.execution_count, 0)
AND qt.text LIKE '%PNLYearToDate_v01iws %'
ORDER BY [Parent Query], p2.statement_start_offset
DROP TABLE #PreWorkQuerySnapShot
DROP TABLE #PostWorkQuerySnapShot
62. Memory used per database
SET TRAN ISOLATION LEVEL READ UNCOMMITTED
SELECT
ISNULL(DB_NAME(database_id), 'ResourceDb') AS DatabaseName
, CAST(COUNT(row_count) * 8.0 / (1024.0) AS DECIMAL(28,2))
AS [Size (MB)]
FROM sys.dm_os_buffer_descriptors
GROUP BY database_id
ORDER BY DatabaseName
63. Memory used by objects in the current database
SET TRANSACTION ISOLATION LEVEL READ UNCOMMITTED
SELECT
OBJECT_NAME(p.[object_id]) AS [TableName]
, (COUNT(*) * 8) / 1024 AS [Buffer size(MB)]
, ISNULL(i.name, '-- HEAP --') AS ObjectName
, COUNT(*) AS NumberOf8KPages
FROM sys.allocation_units AS a
INNER JOIN sys.dm_os_buffer_descriptors AS b
ON a.allocation_unit_id = b.allocation_unit_id
INNER JOIN sys.partitions AS p
INNER JOIN sys.indexes i ON p.index_id = i.index_id
AND p.[object_id] = i.[object_id]
ON a.container_id = p.hobt_id
WHERE b.database_id = DB_ID()
AND p.[object_id] > 100
GROUP BY p.[object_id], i.name
ORDER BY NumberOf8KPages DESC
64. I/O stalls at the database level
SET TRAN ISOLATION LEVEL READ UNCOMMITTED
SELECT DB_NAME(database_id) AS [DatabaseName]
, SUM(CAST(io_stall / 1000.0 AS DECIMAL(20,2))) AS [IO stall (secs)]
, SUM(CAST(num_of_bytes_read / 1024.0 / 1024.0 AS DECIMAL(20,2)))
AS [IO read (MB)]
, SUM(CAST(num_of_bytes_written / 1024.0 / 1024.0 AS DECIMAL(20,2)))
AS [IO written (MB)]
, SUM(CAST((num_of_bytes_read + num_of_bytes_written)
/ 1024.0 / 1024.0 AS DECIMAL(20,2))) AS [TotalIO (MB)]
FROM sys.dm_io_virtual_file_stats(NULL, NULL)
GROUP BY database_id
ORDER BY [IO stall (secs)] DESC
65. I/O waits at the file level
SET TRAN ISOLATION LEVEL READ UNCOMMITTED
SELECT DB_NAME(database_id) AS [DatabaseName]
, file_id
, SUM(CAST(io_stall / 1000.0 AS DECIMAL(20,2))) AS [IO stall (secs)]
, SUM(CAST(num_of_bytes_read / 1024.0 / 1024.0 AS DECIMAL(20,2)))
AS [IO read (MB)]
, SUM(CAST(num_of_bytes_written / 1024.0 / 1024.0 AS DECIMAL(20,2)))
AS [IO written (MB)], SUM(CAST((num_of_bytes_read + num_of_bytes_written)
/ 1024.0 / 1024.0 AS DECIMAL(20,2))) AS [TotalIO (MB)]
FROM sys.dm_io_virtual_file_stats(NULL, NULL)
GROUP BY database_id, file_id
ORDER BY [IO stall (secs)] DESC
66. Average read/write times per file, per database
SET TRAN ISOLATION LEVEL READ UNCOMMITTED
SELECT DB_NAME(database_id) AS DatabaseName
, file_id
, io_stall_read_ms / num_of_reads AS 'Average read time'
, io_stall_write_ms / num_of_writes AS 'Average write time'
FROM sys.dm_io_virtual_file_stats(NULL, NULL)
WHERE num_of_reads > 0 and num_of_writes > 0
ORDER BY DatabaseName


 Important