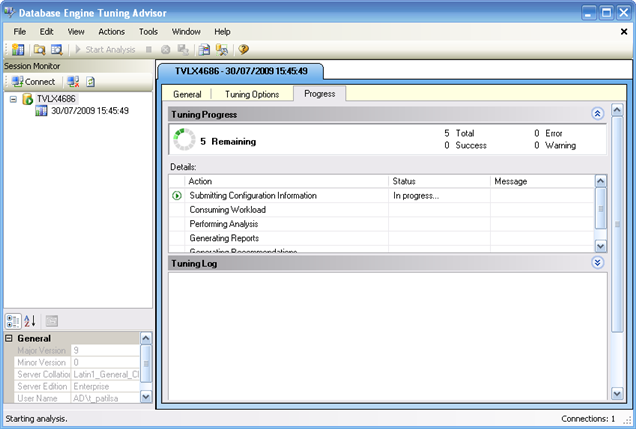
Let’s create a TRACE for Performance Analysis
USE [Test]
GO
/****** Object: Table [dbo].[Person] Script Date: 07/30/2009 15:33:32 ******/
SET ANSI_NULLS ON
GO
SET QUOTED_IDENTIFIER ON
GO
SET ANSI_PADDING ON
GO
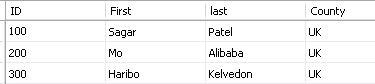
CREATE TABLE [dbo].[Person](
[ID] [int] NOT NULL,
[First] [varchar](50) COLLATE Latin1_General_CI_AS NULL,
[last] [varchar](50) COLLATE Latin1_General_CI_AS NULL,
[County] [varchar](50) COLLATE Latin1_General_CI_AS NULL,
CONSTRAINT [PK_Person] PRIMARY KEY CLUSTERED
(
[ID] ASC
)WITH (IGNORE_DUP_KEY = OFF) ON [PRIMARY]
) ON [PRIMARY]
GO
SET ANSI_PADDING OFF
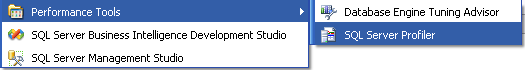
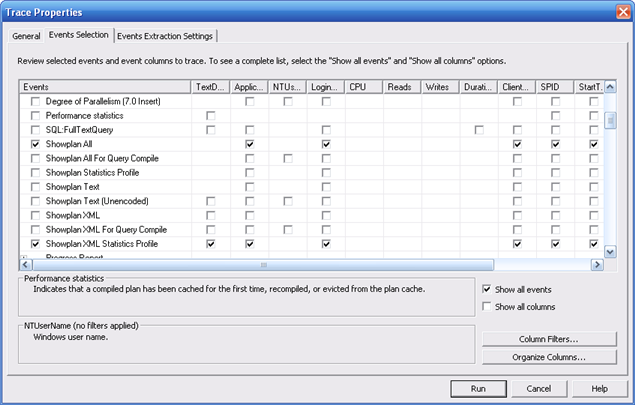
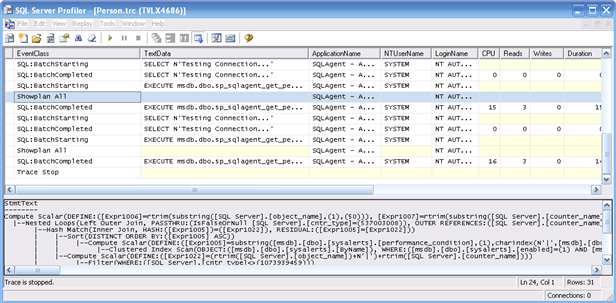
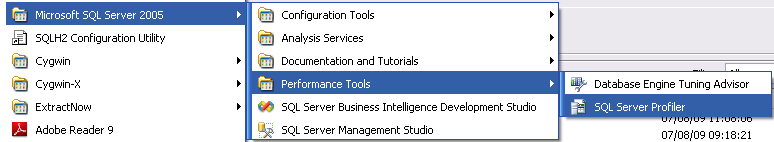
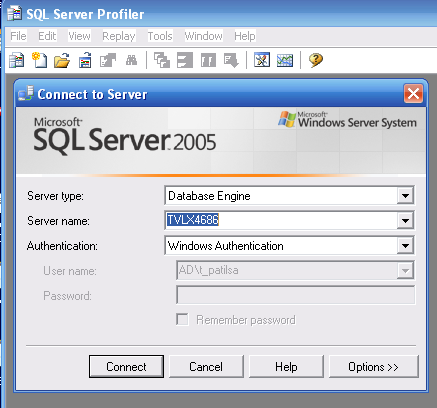
Let’s enable TRACE using SQL Profiler
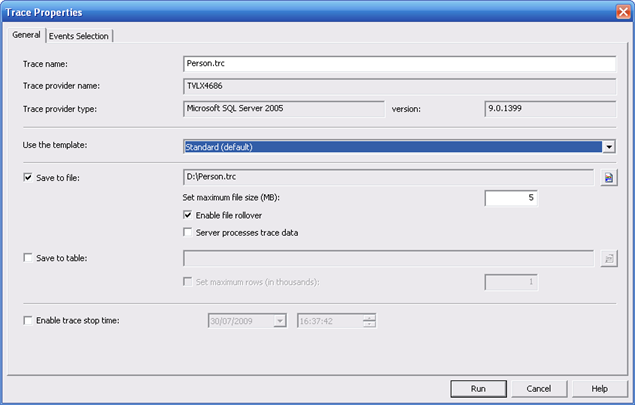
Click on “Events Selection” and then choose “Show All Events”. I picked up “ShowPlan All” & “Performance Statistics” & then hit RUN
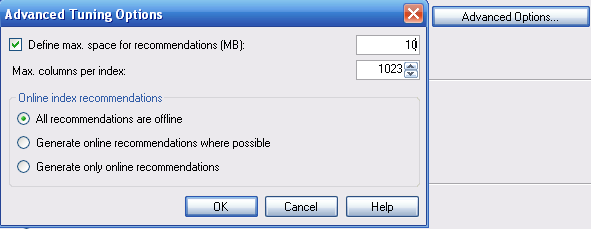
One defined click on 
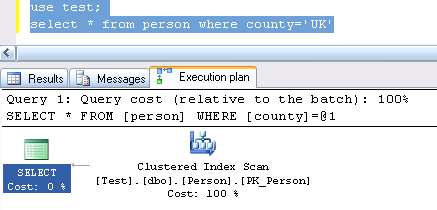
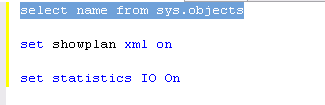
Enable IO and Explain Plan settings using “set options”
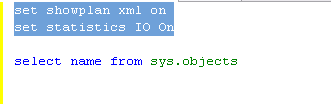
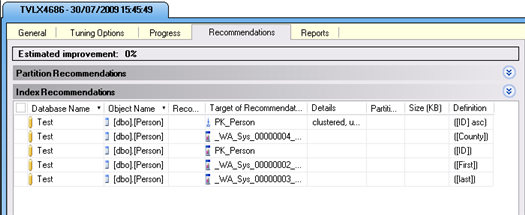
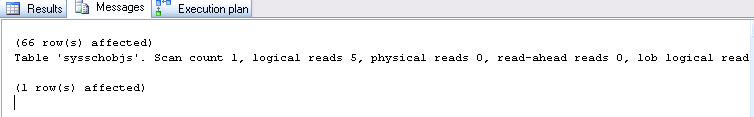
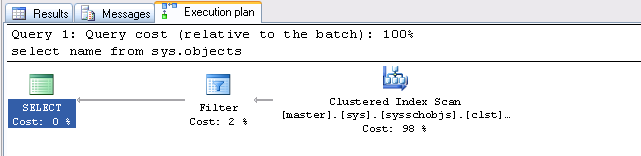
Run the SQL and look at “Messages” & “Execution plan” tab to see the relevant output.

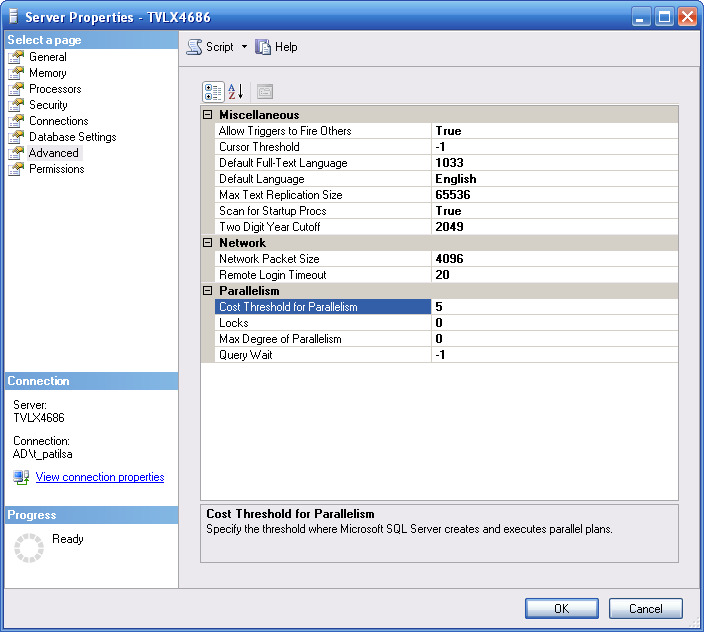
Right click on “server name” and select “properties”
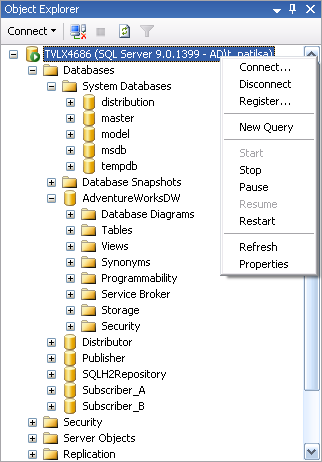
If you have BATCH processing environment , try increasing MAX degree of Parallism to enhance query performance.
SQL server will use Parallism for any SQL whose cost is more than 5
- Windows System Monitor – PART I
- DBCC commands – PART II
- Dynamic Memory Views – PART III
- SQL Server Profiler – – PART IV
There are 2 types of dynamic views, System and Database views.
System views are located at System Databases -> Master -> Views -> DM_OS_XXXX
sys.dm_os_buffer_descriptors
sys.dm_os_memory_pools
sys.dm_os_child_instances
sys.dm_os_nodes
sys.dm_os_cluster_nodes
sys.dm_os_performance_counters
sys.dm_os_dispatcher_pools
sys.dm_os_process_memory
sys.dm_os_hosts
sys.dm_os_schedulers
sys.dm_os_latch_stats
sys.dm_os_stacks
sys.dm_os_loaded_modules
sys.dm_os_sys_info
sys.dm_os_memory_brokers
sys.dm_os_sys_memory
sys.dm_os_memory_cache_clock_hands
sys.dm_os_tasks
sys.dm_os_memory_cache_counters
sys.dm_os_threads
sys.dm_os_memory_cache_entries
sys.dm_os_virtual_address_dump
sys.dm_os_memory_cache_hash_tables
sys.dm_os_wait_stats
sys.dm_os_memory_clerks
sys.dm_os_waiting_tasks
sys.dm_os_memory_nodes
sys.dm_os_workers
sys.dm_os_memory_objects
Database views are located at User Database ->views -> DM_DB_XXX , DM_Exec_XXX etc
sys.dm_exec_background_job_queue
sys.dm_exec_query_optimizer_info
sys.dm_exec_background_job_queue
sys.dm_exec_query_plan
sys.dm_exec_background_job_queue_stats
sys.dm_exec_query_resource_semaphores
sys.dm_exec_cached_plans
sys.dm_exec_query_stats
sys.dm_exec_cached_plan_dependent_objects
sys.dm_exec_requests
sys.dm_exec_connections
sys.dm_exec_sessions
sys.dm_exec_cursors
sys.dm_exec_sql_text
sys.dm_exec_plan_attributes
sys.dm_exec_text_query_plan
sys.dm_exec_procedure_stats
sys.dm_exec_trigger_stats
sys.dm_exec_query_memory_grants
sys.dm_exec_xml_handles
sys.dm_db_file_space_usage
sys.dm_db_session_space_usage
sys.dm_db_partition_stats
sys.dm_db_task_space_usage
sys.dm_db_persisted_sku_features
Here is a situation – users are complaining about a slow SQL server response.
We want to quantify if that is result of a hard hitting SQL query or this is to do with some application/background jobs running on the server.
Let’s put to practise our skills from http://www.oracledbasupport.co.uk/troubleshooting-bottlenecks-using-sql-server-profiler-part-iv/ & http://www.oracledbasupport.co.uk/troubleshooting-bottlenecks-using-windows-system-monitor-part-i/
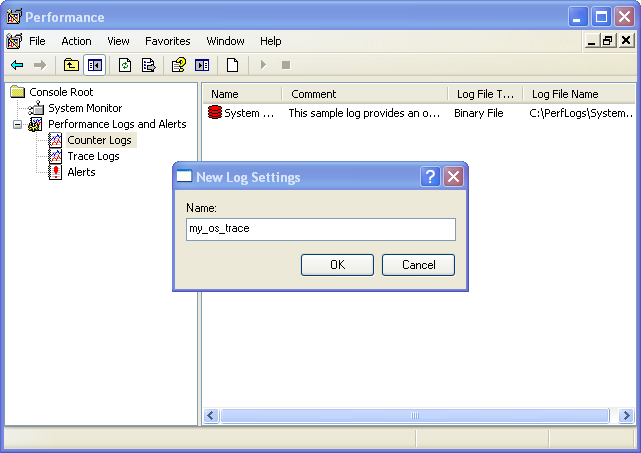
Please initiate a Trace on SQL server before going ahead. Within a SQL server Profiler window click on the top button for “Performancve Monitor” to enable logging.
 Read more…
- Windows System Monitor – PART I
- DBCC commands – PART II
- Dynamic Memory Views – PART III
- SQL Server Profiler – – PART IV
SQL Server Profiler – – PART IV
Read more…
T-SQL script to add a server load . I have used this script to test backup timings, replication latency. One run of following procedure incerased log fie to 8GB and datafile to 6GB
use subscriber_A
go
if exists (select * from sysobjects where name = ‘Load_Data’)
drop table Load_Data
go
create table Load_Data (
x int not null,
y char(896) not null default (”),
z char(120) not null default(”)
)
go
insert Load_Data (x)
select r
from
(
select row_number() over (order by (select 1)) r
from master..spt_values a, master..spt_values b
) p
where r <= 4000000
go
create clustered index ix_x on Load_Data (x, y)
with fillfactor=51
go

 Tweet
Tweet
